GBP/USD
Analysis:
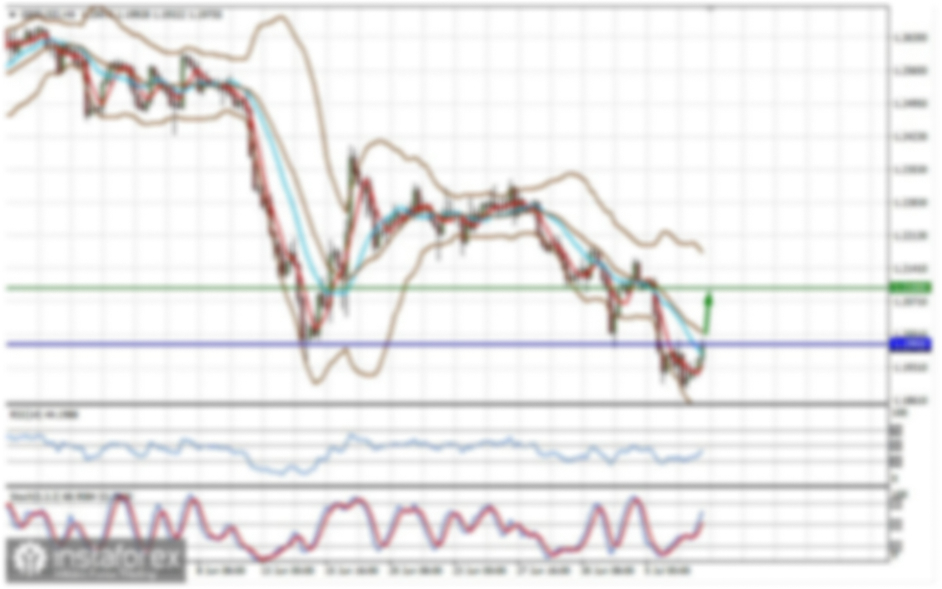
The major pair of the British pound continues its upward movement, which began at the start of this month. The price has broken through intermediate resistance, opening the way for further growth. Before the trend continues, it is necessary to raise the wave level of the movement through a correction.
Forecast:
At the beginning of the upcoming week, a brief sideways movement on the British pound chart is possible. Pressure on the support level, with a potential short-term breach of its lower boundary, cannot be ruled out. A reversal and a resumption of upward movement are expected afterward. The highest activity is likely by the end of the week.
Potential Reversal Zones
Resistance: 1.3100/1.3150Support: 1.2860/1.2810
Recommendations:
Purchases: Are associated with increased risk and will become possible after the appearance of corresponding signals in the support area.Sales: There will be no conditions for such trades in the GBP/USD market in the coming days.
AUD/USD
Analysis:
On the daily scale of the Australian dollar chart, a sideways movement has been observed over the last two years. The current bullish segment started on August 5. After a correction that ended on August 11, the final part of wave (C) began to form. The projected support level lies along the upper boundary of a significant potential reversal zone.
Forecast:
At the beginning of the coming week, a brief decline is expected, down to contact with the support zone. A change in direction and the start of price growth can be expected afterward. The highest activity is likely toward the end of the week.
Potential Reversal Zones
Resistance: 0.6750/0.6800Support: 0.6620/0.6570
Recommendations:
Purchases: Are premature until confirmed signals appear in the support zone.Sales: Have low potential and may become unprofitable.
USD/CHF
Analysis:
Since November last year, a downward trend has been developing on the Swiss franc chart. Its structure is now complete. The wave level of the upward segment that began on August 5 indicates potential for a reversal. Since the beginning of last week, the quotes have been moving sideways, gradually forming a correction.
Forecast:
Throughout the upcoming week, an overall upward movement vector is expected. In the first few days, a decline and sideways movement along the support zone are possible. The highest activity is expected towards the end of the week. The resistance zone shows the upper boundary of the expected weekly move.
Potential Reversal Zones
Resistance: 0.8860/0.8910Support: 0.8570/0.8520
Recommendations:
Purchases: Will become possible in the coming days after signals appear on trading systems.Sales: Are high-risk and have low potential.
EUR/JPY
Analysis:
The upward wave of the euro against the Japanese yen, starting on August 5, has established a new short-term trend. A correction is needed in the wave structure. After breaking through another resistance level, the price is moving sideways along it, forming a shifting pattern.
Forecast:
In the upcoming week, the pair's quotes are expected to continue moving within a price channel between the nearest opposing zones. At the beginning of the week, pressure on the support zone is possible. A reversal and the beginning of upward movement can be expected closer to the weekend.
Potential Reversal Zones
Resistance: 165.70/166.20Support: 161.30/160.80
Recommendations:
Sales: Are high-risk and have limited potential.Purchases: Will become possible after reversal signals appear in the support area as indicated by trading systems.
AUD/JPY
Analysis:
The direction of the short-term trend of the Australian dollar/Japanese yen pair has been set by the upward wave since the beginning of this month. The wave level of this movement indicates potential for a reversal, at least on the H4 chart. The price movements on the chart over the past two weeks show the formation of a hidden, irregular correction. The final segment is missing from its structure.
Forecast:
In the upcoming week, the price is expected to continue moving within the channel between the nearest opposing zones. After a decline and possible pressure on the support zone, a reversal and a shift to an upward vector are expected.
Potential Reversal Zones
Resistance: 100.80/101.30Support: 96.90/96.40
Recommendations:
Purchases: Are premature until reversal signals appear in the support zone as indicated by trading systems.Sales: Are possible within intraday trading with a fractional volume. Potential is limited by support.
Ethereum
Analysis:
After a period of decline since the beginning of August, the trend on the Ethereum chart has changed. The upward wave has a high wave level. On the daily scale of the chart, this segment has initiated a new trend. Wave analysis indicates that the corrective phase (B) within this wave is nearing completion.
Forecast:
At the beginning of the upcoming week, a continuation of the downward vector is expected. A price decline is likely to reach the support boundaries, where the zone of potential reversal of the larger timeframe passes. A change in direction and a resumption of Ethereum's price rise are expected thereafter.
Potential Reversal Zones
Resistance: 2870.0/2920.0Support: 2450.0/2400.0
Recommendations:
Sales: Can be used within individual sessions with a reduced volume. Potential is limited by support.Purchases: Are premature until confirmed reversal signals appear in the support zone as indicated by trading systems.
US Dollar Index
Analysis:
The downward trend wave of the U.S. dollar index has completed. The high wave level of the upward segment from August 5 demonstrates a new emerging trend. At present, the wave level of this movement suggests that the emerging trend is significant enough to be observed on the daily chart. The quotes are forming a correction along the upper boundary of the potential reversal zone.
Forecast:
At the beginning of the current week, the sideways movement of the dollar index is expected to continue. Closer to the weekend, there is a high probability of increased volatility and a resumption of the upward trend. The calculated resistance shows the upper boundary of the expected weekly move.
Potential Reversal Zones
Resistance: 103.300/103.50Support: 102.20/102.00
Recommendations:
A change in trend is anticipated in the forex market. During the upcoming week, the beginning of a decline in the positions of national currencies in major pairs can be expected.
Explanations: In simplified wave analysis (SWA), all waves consist of three parts (A-B-C). The last, unfinished wave is analyzed on each timeframe. The solid arrows show the formed structure, while the dashed arrows indicate expected movements.
Note: The wave algorithm does not account for the duration of instrument movements over time!