signal strength 1 of 5
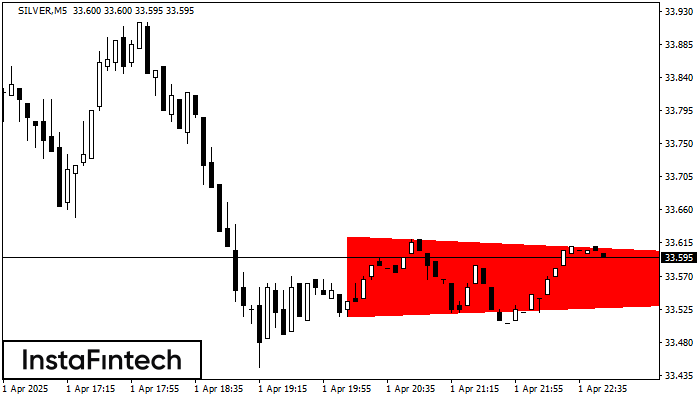
According to the chart of M5, SILVER formed the Bearish Symmetrical Triangle pattern. This pattern signals a further downward trend in case the lower border 33.52 is breached. Here, a hypothetical profit will equal the width of the available pattern that is -109 pips.
The M5 and M15 time frames may have more false entry points.
- All
- Double Top
- Flag
- Head and Shoulders
- Pennant
- Rectangle
- Triangle
- Triple top
- All
- #AAPL
- #AMZN
- #Bitcoin
- #EBAY
- #FB
- #GOOG
- #INTC
- #KO
- #MA
- #MCD
- #MSFT
- #NTDOY
- #PEP
- #TSLA
- #TWTR
- AUDCAD
- AUDCHF
- AUDJPY
- AUDUSD
- EURCAD
- EURCHF
- EURGBP
- EURJPY
- EURNZD
- EURRUB
- EURUSD
- GBPAUD
- GBPCHF
- GBPJPY
- GBPUSD
- GOLD
- NZDCAD
- NZDCHF
- NZDJPY
- NZDUSD
- SILVER
- USDCAD
- USDCHF
- USDJPY
- USDRUB
- All
- M5
- M15
- M30
- H1
- D1
- All
- Buy
- Sale
- All
- 1
- 2
- 3
- 4
- 5
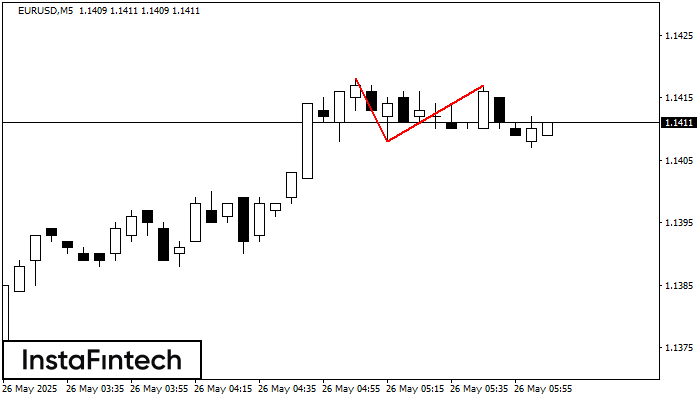
On the chart of EURUSD M5 the Double Top reversal pattern has been formed. Characteristics: the upper boundary 1.1417; the lower boundary 1.1408; the width of the pattern 9 points
The M5 and M15 time frames may have more false entry points.
Open chart in a new window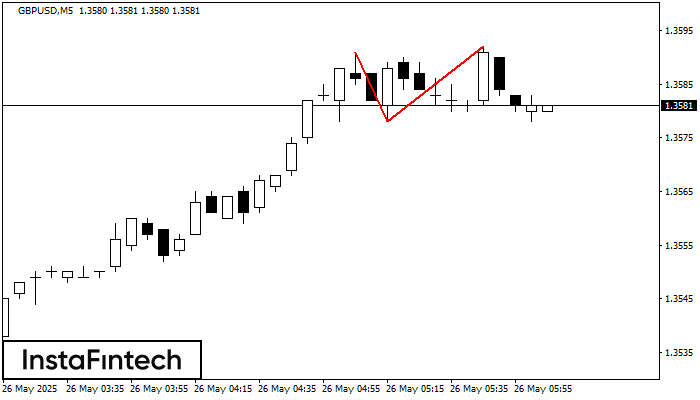
On the chart of GBPUSD M5 the Double Top reversal pattern has been formed. Characteristics: the upper boundary 1.3592; the lower boundary 1.3578; the width of the pattern 14 points
The M5 and M15 time frames may have more false entry points.
Open chart in a new window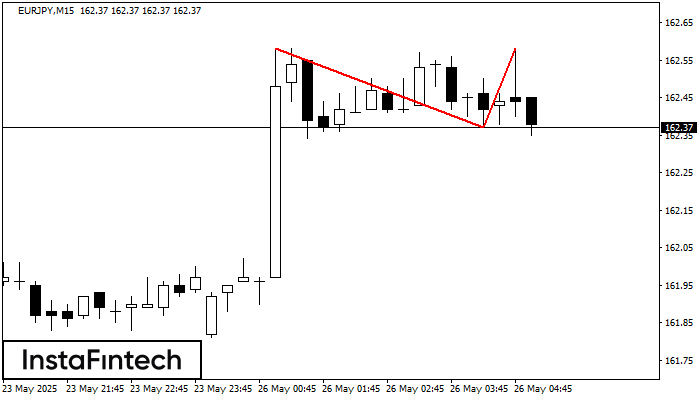
On the chart of EURJPY M15 the Double Top reversal pattern has been formed. Characteristics: the upper boundary 162.58; the lower boundary 162.37; the width of the pattern 21 points
The M5 and M15 time frames may have more false entry points.
Open chart in a new window