signal strength 4 of 5

According to the chart of H1, EURUSD formed the Bullish Symmetrical Triangle pattern, which signals the trend will continue. Description. The upper border of the pattern touches the coordinates 1.0849/1.0814 whereas the lower border goes across 1.0777/1.0814. The pattern width is measured on the chart at 72 pips. If the Bullish Symmetrical Triangle pattern is in progress during the upward trend, this indicates the current trend will go on. In case 1.0814 is broken, the price could continue its move toward 1.0854.
- All
- Double Top
- Flag
- Head and Shoulders
- Pennant
- Rectangle
- Triangle
- Triple top
- All
- #AAPL
- #AMZN
- #Bitcoin
- #EBAY
- #FB
- #GOOG
- #INTC
- #KO
- #MA
- #MCD
- #MSFT
- #NTDOY
- #PEP
- #TSLA
- #TWTR
- AUDCAD
- AUDCHF
- AUDJPY
- AUDUSD
- EURCAD
- EURCHF
- EURGBP
- EURJPY
- EURNZD
- EURRUB
- EURUSD
- GBPAUD
- GBPCHF
- GBPJPY
- GBPUSD
- GOLD
- NZDCAD
- NZDCHF
- NZDJPY
- NZDUSD
- SILVER
- USDCAD
- USDCHF
- USDJPY
- USDRUB
- All
- M5
- M15
- M30
- H1
- D1
- All
- Buy
- Sale
- All
- 1
- 2
- 3
- 4
- 5
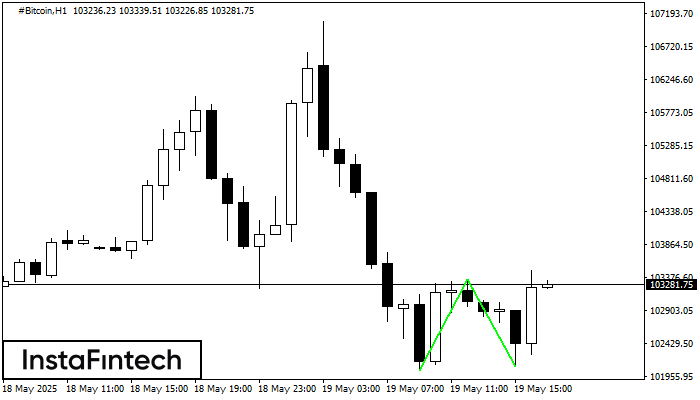
डबल बॉटम पैटर्न #Bitcoin H1 पर बना है। यह फॉर्मेशन नीचे से ऊपर की ओर प्रवृत्ति के उलट होने का संकेत देता है। संकेत यह है कि पैटर्न 103355.86 की
Open chart in a new window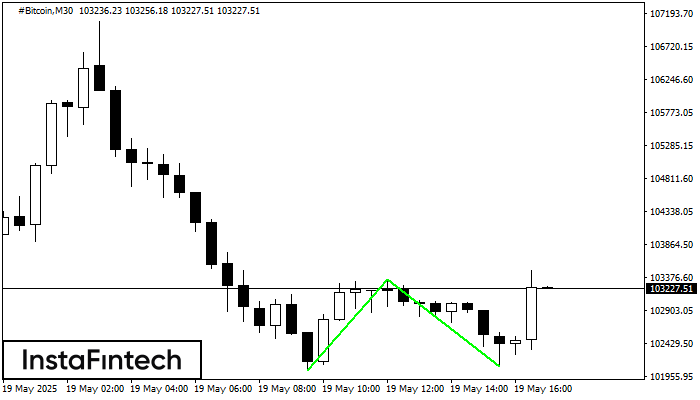
डबल बॉटम पैटर्न #Bitcoin M30 पर बना है; ऊपरी सीमा 103355.86 है; निचली सीमा 102090.12 है। पैटर्न की चौड़ाई 131679 अंक है। ऊपरी सीमा 103355.86 के टूटने के मामले में
Open chart in a new window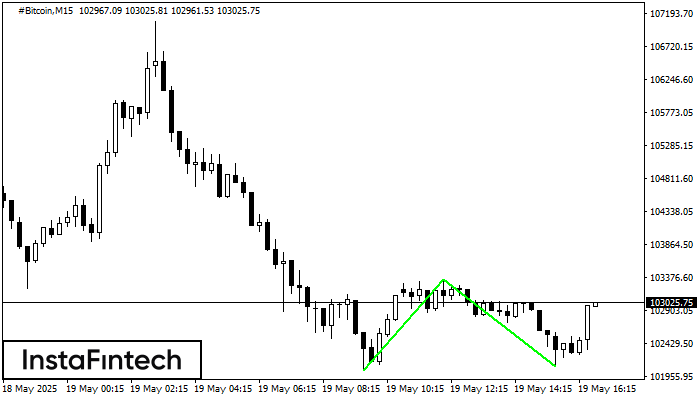
डबल बॉटम पैटर्न #Bitcoin M15 पर बना है; ऊपरी सीमा 103355.86 है; निचली सीमा 102090.12 है। पैटर्न की चौड़ाई 131679 अंक है। ऊपरी सीमा 103355.86 के टूटने के मामले में
M5 और M15 समय सीमा में अधिक फाल्स एंट्री पॉइंट्स हो सकते हैं।
Open chart in a new window