signal strength 2 of 5
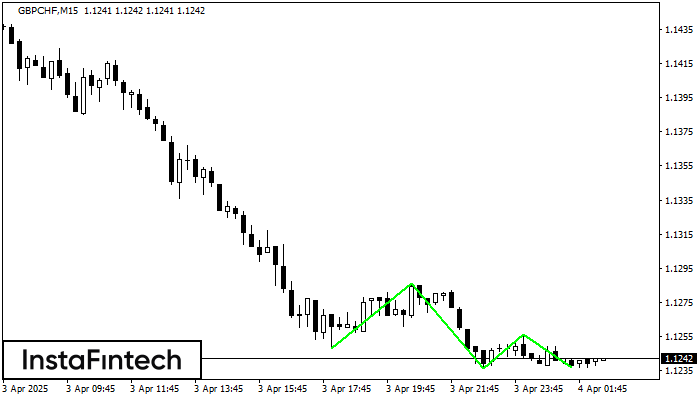
The Triple Bottom pattern has formed on the chart of the GBPCHF M15 trading instrument. The pattern signals a change in the trend from downwards to upwards in the case of breakdown of 1.1286/1.1256.
The M5 and M15 time frames may have more false entry points.
See Also
- All
- Double Top
- Flag
- Head and Shoulders
- Pennant
- Rectangle
- Triangle
- Triple top
- All
- #AAPL
- #AMZN
- #Bitcoin
- #EBAY
- #FB
- #GOOG
- #INTC
- #KO
- #MA
- #MCD
- #MSFT
- #NTDOY
- #PEP
- #TSLA
- #TWTR
- AUDCAD
- AUDCHF
- AUDJPY
- AUDUSD
- EURCAD
- EURCHF
- EURGBP
- EURJPY
- EURNZD
- EURRUB
- EURUSD
- GBPAUD
- GBPCHF
- GBPJPY
- GBPUSD
- GOLD
- NZDCAD
- NZDCHF
- NZDJPY
- NZDUSD
- SILVER
- USDCAD
- USDCHF
- USDJPY
- USDRUB
- All
- M5
- M15
- M30
- H1
- D1
- All
- Buy
- Sale
- All
- 1
- 2
- 3
- 4
- 5
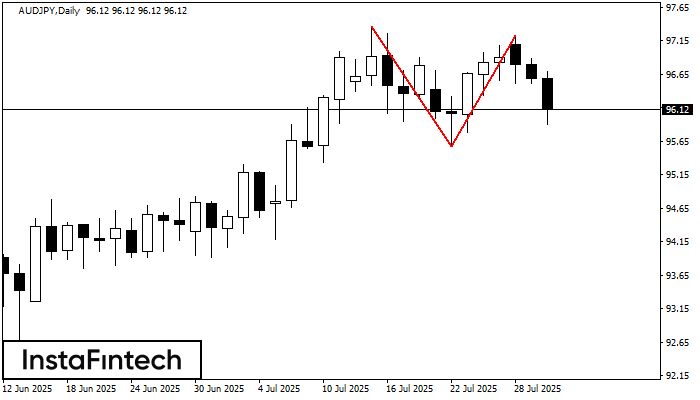
On the chart of AUDJPY D1 the Double Top reversal pattern has been formed. Characteristics: the upper boundary 97.23; the lower boundary 95.57; the width of the pattern 166 points
Open chart in a new window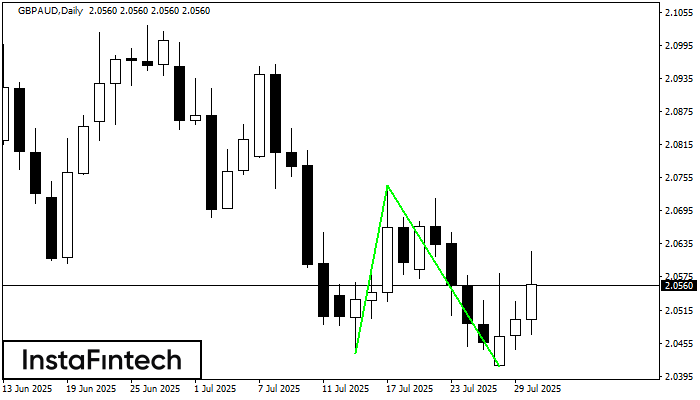
The Double Bottom pattern has been formed on GBPAUD D1. Characteristics: the support level 2.0437; the resistance level 2.0741; the width of the pattern 304 points. If the resistance level
Open chart in a new window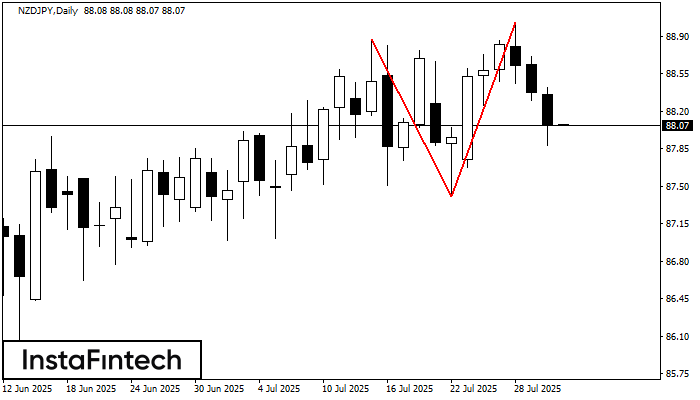
The Double Top pattern has been formed on NZDJPY D1. It signals that the trend has been changed from upwards to downwards. Probably, if the base of the pattern 87.40
Open chart in a new window