empty
05.02.2024 12:18 PM
EUR/USD and GBP/USD: Trading plan for beginner traders on February 5

Details of the Economic Calendar on February 2

The United States Department of Labor report grabbed investors' attention on Friday, which unexpectedly reflected an intensification of "overheating" in the labor market. Firstly, the job growth (353,000) was nearly double the consensus forecast (180,000) and marked the highest in the past year. Additionally, December data was revised upward from 216,000 to 333,000. These figures significantly exceed the expected 70–100,000 per month, which Federal Reserve Chairman Jerome Powell considers proportional to the increase in the working-age population.

Secondly, the unemployment rate remained at 3.7% for the third consecutive month, surpassing the market expectation of an increase to 3.8%. Thirdly, the growth in average hourly wages unexpectedly accelerated from 0.4% month-on-month in December to 0.6% (the highest since March 2022), while a slowdown to 0.3% was anticipated. On a yearly basis, wage growth accelerated from 4.1% to 4.5% (the highest since September of the previous year). According to experts, the wage growth rate corresponding to the 2% inflation target of the Federal Reserve is in the range of 3.0–3.5% year-on-year. The only weak indicator in the report was the reduction in the average workweek duration.

Based on this data, the U.S. dollar sharply strengthened.

This image is no longer relevant

Analysis of Trading Charts from February 2

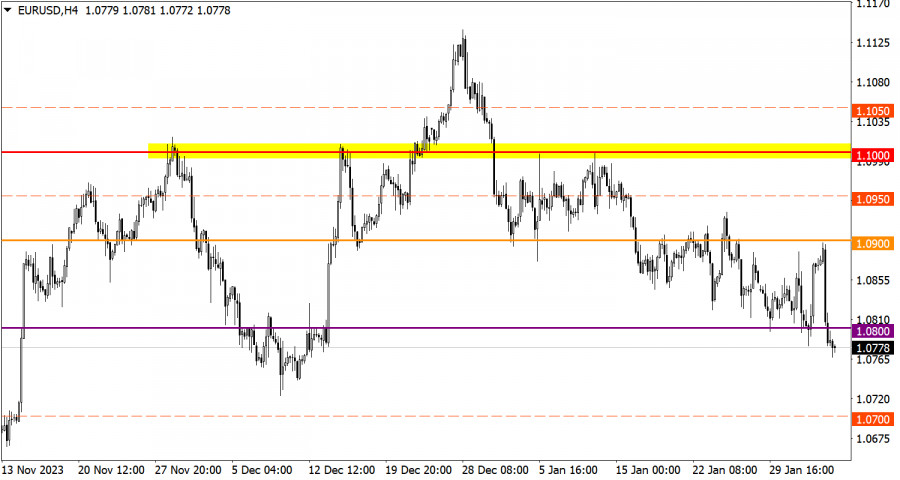
As a result of active speculation, EUR/USD broke below the support level of 1.0800, leading to a continuation of the current downward cycle in the market. This trend is accompanied by an increase in the volume of short positions on the euro.

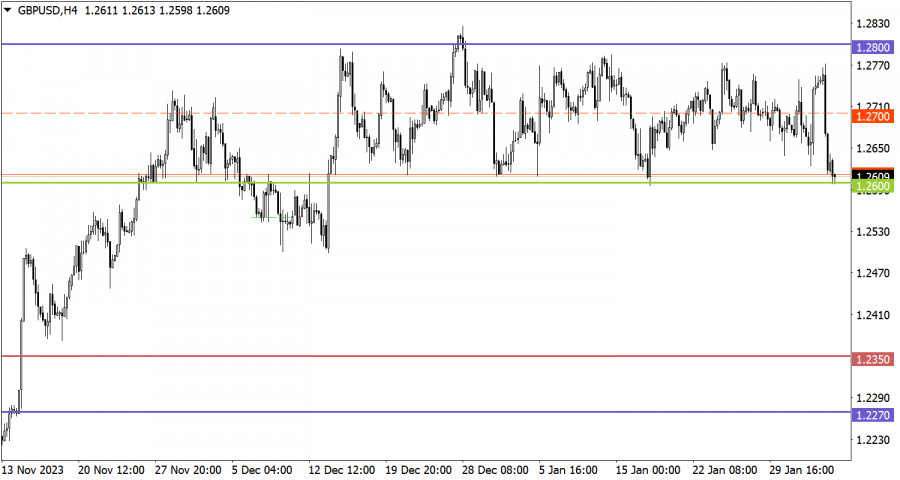
Synchronously with the overall market movement, the GBP/USD currency pair also headed downward, causing a depreciation of the pound sterling by more than 1%, which is about 150 points. Despite significant price fluctuations, no radical changes occurred, and the quote remains within the range of the sideways channel 1.2600/1.2800, which has persisted for several weeks.

Economic Calendar on February 5

Today, the dollar is likely to continue strengthening its position in the market. The decline in producer prices in the European Union is expected to accelerate from -8.8% to -10.2%. This significant decline in producer prices indicates growing deflation risks in the European economy. Despite recent high inflation in Europe, prompting the European Central Bank (ECB) to pursue a strict monetary policy, inflation is now declining, and the producer price index suggests the possibility of deflation.

The ECB will inevitably have to start easing its monetary policy. Thus, a situation arises where by the time the Federal Reserve starts lowering interest rates, the ECB will have already taken several similar steps. The level of interest rates in Europe is already lower than in the United States.

It is also worth noting that Fed Chair Powell expressed concerns about lowering interest rates, citing conflicting macroeconomic data in his weekend interview. This gives the U.S. dollar a certain advantage in the market.

EUR/USD Trading Plan for February 5

Steady price retention below 1.0800 increases the probability of further euro depreciation. However, note that technical signs of oversold conditions are already observed in the short term, which may have a negative impact on the volume of short positions.

This image is no longer relevant

GBP/USD Trading Plan for February 5

Based on the theory of trading within the channel, touching the lower boundary of 1.2600 may negatively impact the volume of short positions on the pound sterling. In this case, a price rebound towards the average level of 1.2700 is possible. However, if the price stabilizes below the 1.2600 boundary during the day, a break in the sideways channel may occur, leading to subsequent movement towards a breakthrough.

This image is no longer relevant

What's on the charts

The candlestick chart type is white and black graphic rectangles with lines above and below. With a detailed analysis of each individual candle, you can see its characteristics relative to a particular time frame: opening price, closing price, intraday high and low.

Horizontal levels are price coordinates, relative to which a price may stop or reverse its trajectory. In the market, these levels are called support and resistance.

Circles and rectangles are highlighted examples where the price reversed in history. This color highlighting indicates horizontal lines that may put pressure on the asset's price in the future.

The up/down arrows are landmarks of the possible price direction in the future.

Gven Podolsky,
Analytical expert of InstaForex
© 2007-2025
Select timeframe
5
min
15
min
30
min
1
hour
4
hours
1
day
1
week
Earn on cryptocurrency rate changes with InstaForex
Download MetaTrader 4 and open your first trade
  • Grand Choice
    Contest by
    InstaForex
    InstaForex always strives to help you
    fulfill your biggest dreams.
    JOIN CONTEST

Recommended Stories

How to Trade the GBP/USD Pair on May 16? Simple Tips and Trade Analysis for Beginners

Analysis of Thursday's Trades 1H Chart of GBP/USD On Thursday, the GBP/USD pair showed minimal upward movement; however, the 5-minute timeframe indicates this was largely a sideways move

Paolo Greco 06:17 2025-05-16 UTC+2

How to Trade the EUR/USD Pair on May 16? Simple Tips and Trade Analysis for Beginners

Analysis of Thursday's Trades 1H Chart of EUR/USD The EUR/USD currency pair traded in both directions throughout Thursday. The macroeconomic background was rich, but it had no decisive impact

Paolo Greco 06:17 2025-05-16 UTC+2

Trading Recommendations and Analysis for GBP/USD on May 16: The Pound Decided to Take a Break

On Thursday, the GBP/USD currency pair traded strictly sideways with low volatility. Despite a busy macroeconomic calendar, the market ignored most of the data, just as anticipated

Paolo Greco 03:54 2025-05-16 UTC+2

Trading Recommendations and Analysis for EUR/USD on May 16: The Market Has Once Again Confirmed the Obvious

On Thursday, the EUR/USD currency pair showed only one thing—a complete unwillingness to move. We observed sideways movement throughout the day despite a fairly packed macroeconomic calendar. However, as mentioned

Paolo Greco 03:54 2025-05-16 UTC+2

How to Trade the GBP/USD Pair on May 15? Simple Tips and Trade Analysis for Beginners

Analysis of Wednesday's Trades 1H Chart of GBP/USD The GBP/USD pair continued its upward movement throughout Wednesday, despite the absence of any specific fundamental reasons. The day before, a U.S

Paolo Greco 06:21 2025-05-15 UTC+2

How to Trade the EUR/USD Pair on May 15? Simple Tips and Trade Analysis for Beginners

Analysis of Wednesday's Trades 1H Chart of EUR/USD The EUR/USD currency pair experienced upward movement for approximately half of Wednesday. The latest "surge" in the euro was particularly "impressive," although

Paolo Greco 06:21 2025-05-15 UTC+2

Trading Recommendations and Analysis for GBP/USD on May 15: The Roller Coaster Begins

On Wednesday, the GBP/USD currency pair continued trading with an upward bias for some time, but it resumed its decline in the afternoon. From our perspective, the U.S. dollar

Paolo Greco 03:41 2025-05-15 UTC+2

Trading Recommendations and Analysis for EUR/USD on May 15: Heading Down Again or Waiting for Trump?

The EUR/USD currency pair continued upward movement on Wednesday, but only briefly. In the afternoon, the euro started to decline, despite the lack of macroeconomic factors supporting such moves. Donald

Paolo Greco 03:41 2025-05-15 UTC+2

How to Trade the GBP/USD Pair on May 14? Simple Tips and Trade Analysis for Beginners

Analysis of Tuesday's Trades 1H Chart of GBP/USD On Tuesday, the GBP/USD pair experienced significant growth, despite no clear catalyst behind it. On Monday, the dollar rose on specific grounds

Paolo Greco 06:11 2025-05-14 UTC+2

How to Trade the EUR/USD Pair on May 14? Simple Tips and Trade Analysis for Beginners

Analysis of Tuesday's Trades 1H Chart of EUR/USD On Tuesday, the EUR/USD currency pair nearly fully recovered from Monday's decline. As reality has shown, strong reasons are required

Paolo Greco 06:11 2025-05-14 UTC+2
Can't speak right now?
Ask your question in the chat.
Widget callback
 

Dear visitor,

Your IP address shows that you are currently located in the USA. If you are a resident of the United States, you are prohibited from using the services of InstaFintech Group including online trading, online transfers, deposit/withdrawal of funds, etc.

If you think you are seeing this message by mistake and your location is not the US, kindly proceed to the website. Otherwise, you must leave the website in order to comply with government restrictions.

Why does your IP address show your location as the USA?

  • - you are using a VPN provided by a hosting company based in the United States;
  • - your IP does not have proper WHOIS records;
  • - an error occurred in the WHOIS geolocation database.

Please confirm whether you are a US resident or not by clicking the relevant button below. If you choose the wrong option, being a US resident, you will not be able to open an account with InstaForex anyway.

We are sorry for any inconvenience caused by this message.