GBP/USD 5-Minute Analysis
On Thursday, the GBP/USD currency pair continued to trade in the "euro style." The intraday movements were relatively weak, and the technical picture suggests the trend might shift downward. The price has consolidated below the critical line, but this signal could be false since the US dollar still refuses to rise—or, more precisely, the market refuses to buy it. Even when the macroeconomic backdrop favors the dollar, we're not seeing any upward movement—as was yesterday.
Thus, we conclude that the dollar will unlikely grow until Trump begins rolling back the trade tariffs he introduced. This could happen in a month—or may not happen at all. In the meantime, Trump could raise existing tariffs five more times, and trade deals with China and the European Union (which are of the most interest to traders) could collapse. Therefore, no matter how attractive current levels may look for selling the pair, the current situation calls for extreme caution when considering USD purchases.
Yesterday, several trading signals were formed in the 5-minute time frame. The price first broke through the 1.3288 level, then bounced twice off the critical line, and later bounced again from the 1.3288 level. Technically, the signals were pretty good, as the target levels were reached in three out of four cases. However, since the price remained within a tight range throughout the day, it was difficult to expect significant profit.
COT Report
COT (Commitments of Traders) reports on the British pound show that sentiment among commercial traders has been constantly shifting over recent years. The red and blue lines, representing net positions of commercial and non-commercial traders, frequently intersect and are usually close to the zero mark. This is still the case now, which indicates a roughly equal number of long and short positions.
On the weekly timeframe, the price first broke through the 1.3154 level, then overcame the trendline, returned to 1.3154, and broke it again. The breach of the trendline would typically suggest a high likelihood of further pound declines. However, we continue to see the dollar falling due to Donald Trump. Therefore, trade war news may keep pushing the pound even higher, regardless of the technical picture.
According to the latest COT report on the British pound, the "Non-commercial" group closed 6,000 BUY contracts and opened 4,700 SELL contracts. As a result, the net position of non-commercial traders has declined for the third consecutive week (-10,700 contracts), yet this hasn't had any meaningful impact on price movement.
The fundamental background still doesn't support long-term buying of the British pound, and the currency has realistic chances of continuing its long-term downtrend. The pound has risen sharply in recent months, but the reason is apparent: Trump's policy actions.
GBP/USD 1-Hour Analysis
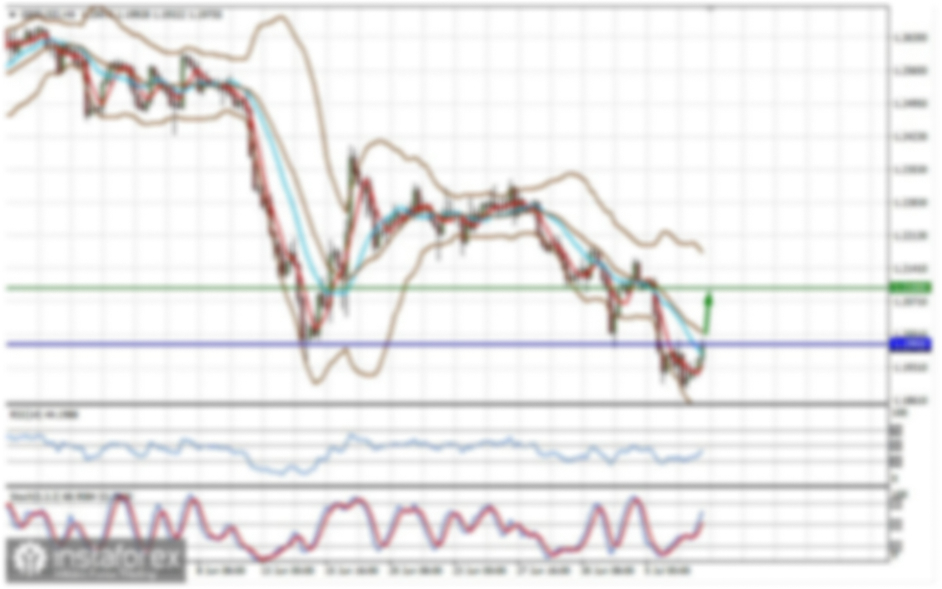
In the 1-hour time frame, the GBP/USD pair showed a strong surge after nearly a month of sideways trading, followed by an even steeper decline and then an even more powerful surge. At the moment, a correction has begun, but it remains weak. The British pound has seen a significant rise recently, but it had little to do with its merits. The entire upward movement of the pound results from a falling dollar triggered by Donald Trump. And it's not over yet. Chaos, confusion, and panic continue to reign in the market, while logic and consistency in movement remain absent.
Key levels for April 25: 1.2691–1.2701, 1.2796–1.2816, 1.2863, 1.2981–1.2987, 1.3050, 1.3125, 1.3212, 1.3288, 1.3358, 1.3439, 1.3489, 1.3537. The Senkou Span B (1.3082) and Kijun-sen (1.3327) lines may also serve as signal levels. It is recommended to place a Stop Loss at breakeven once the price moves 20 pips in the correct direction. Note that the Ichimoku indicator lines may shift during the day, which should be considered when interpreting trading signals.
The UK is scheduled to release its retail sales report on Friday, while the US will publish the University of Michigan Consumer Sentiment Index. We have little doubt that these reports will be mostly overlooked. Even if there is a market reaction, it is unlikely to change the overall picture. And that picture remains simple: the dollar cannot rise.
Illustration Explanations:
- Support and Resistance Levels (thick red lines): Thick red lines indicate where movement may come to an end. Please note that these lines are not sources of trading signals.
- Kijun-sen and Senkou Span B Lines: Ichimoku indicator lines transferred from the 4-hour timeframe to the hourly timeframe. These are strong lines.
- Extreme Levels (thin red lines): Thin red lines where the price has previously bounced. These serve as sources of trading signals.
- Yellow Lines: Trendlines, trend channels, or any other technical patterns.
- Indicator 1 on COT Charts: Represents the net position size for each category of traders.