empty
01.04.2025 11:32 AM
EUR/USD. April 1. Traders Are Confused and Unwilling to Take Risks

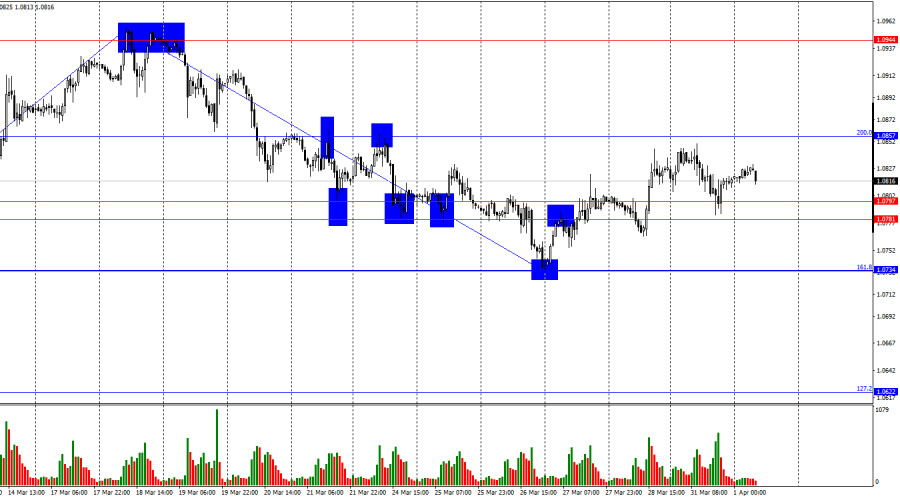
On Monday, the EUR/USD pair continued its upward movement and even rebounded from the support zone at 1.0781–1.0797. However, believing in a further rise of the euro is becoming increasingly difficult. According to wave analysis, the trend has turned bearish, meaning we should expect a decline. The recent growth of the pair is merely a corrective pullback. Therefore, I expect a consolidation below the 1.0781–1.0797 zone and a further fall toward the Fibonacci levels at 1.0734 and 1.0622.

This image is no longer relevant

The wave pattern on the hourly chart has shifted. The last completed upward wave barely broke the previous high, and the most recent downward wave broke below the previous low. Thus, the waves currently indicate a trend reversal to the bearish side. Donald Trump introduced new tariffs last week, which caused the bears to retreat again. Trump is likely to impose more tariffs this week, allowing the bulls another attempt at an advance. However, bulls are weakening with each passing day.

The fundamental backdrop on Monday did not support the bulls. Retail sales in Germany exceeded expectations, but the more important inflation report showed a slowdown to 2.2% y/y. While this figure matched forecasts, the fact that inflation is now nearing the ECB's target level cannot be overlooked. This suggests the ECB's monetary policy may become even more dovish—bad news for the euro. Trump's trade wars have been supporting the bulls for several weeks, but that alone is not enough to sustain continued euro purchases and dollar selling. Traders have already priced in the tariff news, and now other economic drivers are needed for this strategy to remain viable. At the moment, there are none. A large volume of important statistics will be released this week, starting in just a few hours with eurozone inflation data. If inflation also slows, the bears will resume their attack.

This image is no longer relevant

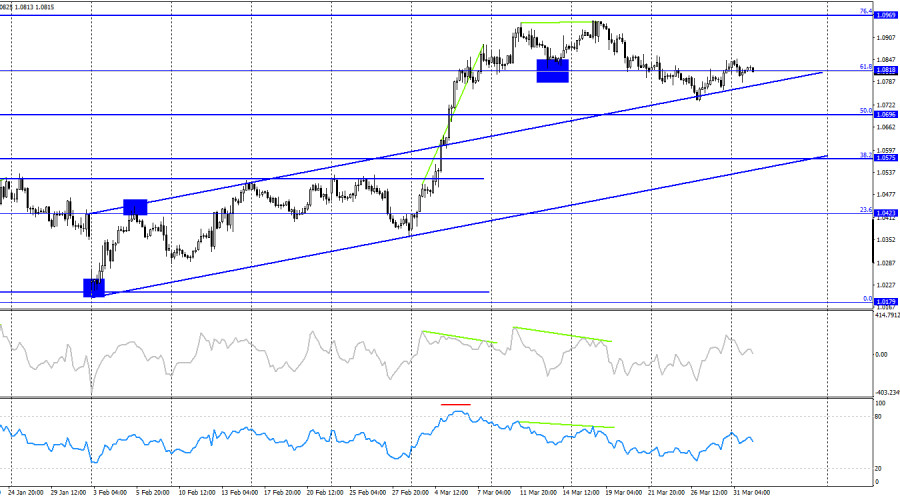
On the 4-hour chart, the pair made a slight upward move, but I expect a new reversal in favor of the U.S. dollar and a further decline toward the 50.0% correction level at 1.0696 and the 38.2% level at 1.0575. While a major drop in the euro is unlikely for now, a 200-point decline would still be timely. No divergence signals are observed on any indicators today.

Commitments of Traders (COT) Report:

This image is no longer relevant

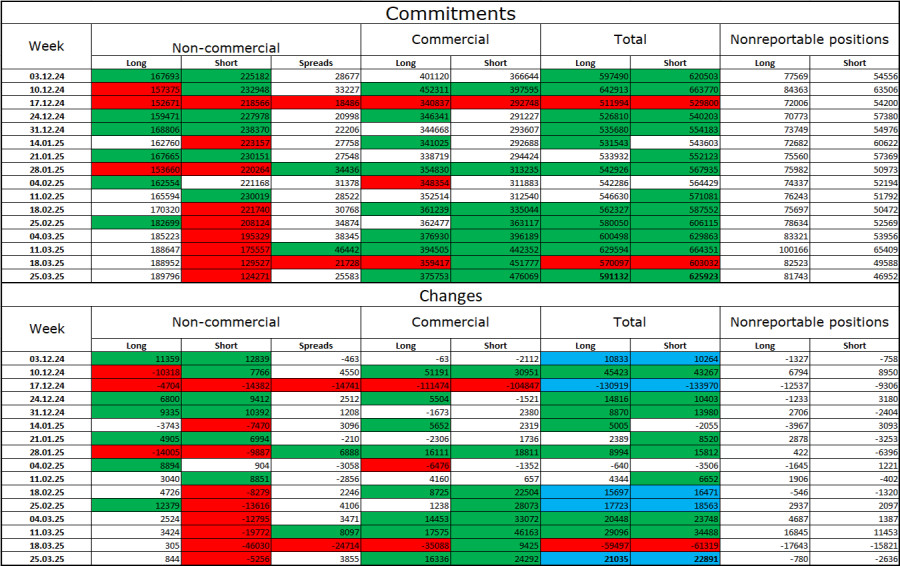
During the most recent reporting week, professional traders opened 844 new long positions and closed 5,256 short positions. The sentiment of the "Non-commercial" group turned bullish again—thanks to Donald Trump. The total number of long positions held by speculators is now 190,000, while short positions have decreased to 124,000.

For twenty weeks in a row, large players had been offloading euros, but for the past seven weeks, they've been reducing short positions and building long ones. While the divergence in ECB and Fed monetary policy continues to favor the U.S. dollar, Trump's policy is becoming a more influential factor for traders, as it may have a dovish impact on the FOMC's approach and even lead to a recession in the U.S. economy.

News Calendar for the U.S. and Eurozone:

  • Eurozone – German Manufacturing PMI (07:55 UTC)
  • Eurozone – Manufacturing PMI (08:00 UTC)
  • Eurozone – Consumer Price Index (09:00 UTC)
  • Eurozone – Speech by ECB President Christine Lagarde (12:30 UTC)
  • U.S. – S&P Manufacturing PMI (13:45 UTC)
  • U.S. – ISM Manufacturing PMI (14:00 UTC)
  • U.S. – JOLTS Job Openings (14:00 UTC)

On April 1, the economic calendar includes a large number of important events at various times throughout the day. The fundamental backdrop may strongly influence market sentiment all day long.

EUR/USD Forecast and Trader Recommendations:

Selling the pair is possible today after a bounce from the 1.0857 level on the hourly chart, with targets at 1.0797 and 1.0734, or after a close below the 1.0781–1.0797 zone. Buying will be possible after a bounce from the 1.0781–1.0797 zone on the hourly chart with a target at 1.0857.

Fibonacci levels are drawn from 1.0529–1.0213 on the hourly chart and from 1.1214–1.0179 on the 4-hour chart.

Pilih carta masa
5
min
15
min
30
min
1
jam
4
jam
1
hari
1
minggu
Jana pendapatan melalui perubahan kadar mata wang kripto dengan InstaForex.
Muat turun MetaTrader 4 dan buka dagangan pertama anda.
  • Grand Choice
    Contest by
    InstaForex
    InstaForex always strives to help you
    fulfill your biggest dreams.
    SERTAI PERADUAN

Artikel yang dicadangkan

Ramalan EUR/USD untuk 16 April 2025

Semalam, penunjuk sentimen ekonomi ZEW bagi zon euro untuk bulan April mencatatkan keputusan yang mengecewakan. Indeks tersebut menjunam daripada 39.8 pada Mac kepada -18.5, jauh lebih rendah berbanding ramalan pada

Laurie Bailey 05:12 2025-04-16 UTC+2

Ramalan USD/JPY untuk 16 April, 2025

Pada carta harian, harga telah membentuk segitiga kecil di sekitar paras 143.45 dan kini berada dalam fasa pengukuhan di bawah paras tersebut. Memandangkan sasaran terdekat pada 141.70 sudah hampir dicapai

Laurie Bailey 05:12 2025-04-16 UTC+2

Isyarat Dagangan EMAS (XAU/USD) untuk 15-18 April 2025: jual di bawah $3,220 (+1/8 Murray - 21 SMA)

Pada awal sesi dagangan Amerika, emas didagangkan sekitar paras 3,220, menunjukkan tanda-tanda keletihan. Pembetulan teknikal selanjutnya ke arah Purata Bergerak Ringkas 21-hari (21 SMA) dijangka berlaku dalam beberapa jam akan

Dimitrios Zappas 14:05 2025-04-15 UTC+2

Ramalan untuk GBP/USD pada 15 April 2025

Pada carta setiap jam, pasangan GBP/USD terus meningkat pada hari Isnin dan berjaya melebihi paras 1.3139. Oleh itu, pergerakan ke atas mungkin berterusan ke arah tahap pembetulan Fibonacci seterusnya pada

Samir Klishi 11:59 2025-04-15 UTC+2

Ramalan untuk EUR/USD pada 15 April 2025

Pada hari Isnin, pasangan EUR/USD terus meningkat tetapi kembali ke tahap penarikan semula Fibonacci 261.8% pada 1.1318 menjelang akhir hari. Dua kali lantunan dari tahap ini membolehkan para pedagang menjangkakan

Samir Klishi 11:55 2025-04-15 UTC+2

Analisis Teknikal Pergerakan Harga Harian bagi Pasangan Mata Wang Silang EUR/JPY, Selasa, 15 April 2025.

Dengan kemunculan Perbezaan antara pergerakan harga pasangan mata wang silang EUR/JPY dengan penunjuk Pengayun Stochastic Oscillator yang turut diikuti dengan kehadiran corak Bullish 123 dan diikuti oleh Bullish Ross Hook

Arief Makmur 07:13 2025-04-15 UTC+2

Analisis Teknikal Pergerakan Harga Intraday GBP/AUD Pasangan Mata Wang Bersilang, Selasa 15 April 2025.

Pada carta 4 jam, pasangan silang mata wang GBP/AUD dilihat bergerak di bawah EMA (21), dan penunjuk Pengayun Stochastic berada dalam keadaan Persilangan JUAL (Crossing SELL). Maka, berdasarkan kedua-dua maklumat

Arief Makmur 07:13 2025-04-15 UTC+2

Isyarat Dagangan EMAS (XAU/USD) untuk 14-17 April 2024: jual di bawah $3,224 (+1/8 Murray - 21 SMA)

Rancangan dagangan kami untuk beberapa jam akan datang ialah menjual emas di bawah 3,224, dengan sasaran di 3,203 dan 3,156. Kita perlu berwaspada terhadap sebarang kenaikan teknikal, kerana prospek masih

Dimitrios Zappas 15:59 2025-04-14 UTC+2

Ramalan untuk EUR/USD pada 14 April 2025

Pada hari Jumaat, pasangan EUR/USD terus meningkat tetapi berundur pada separuh kedua hari tersebut. Penurunan (iaitu pengukuhan dolar) adalah singkat, dan menjelang penghujung Jumaat, dolar AS sekali lagi mencatatkan kerugian

Samir Klishi 12:28 2025-04-14 UTC+2

Ramalan untuk GBP/USD pada 14 April 2025

Pada carta per jam, pasangan GBP/USD meneruskan pergerakan menaiknya pada hari Jumaat dan hari ini menuju ke tahap 1.3151. Pembalikan dari tahap ini akan memihak kepada dolar AS dan berkemungkinan

Samir Klishi 12:25 2025-04-14 UTC+2
Tidak boleh bertanya sekarang?
Tanya soalan anda di Ruangan bersembang.
Panggilan semula Widget
 

Dear visitor,

Your IP address shows that you are currently located in the USA. If you are a resident of the United States, you are prohibited from using the services of InstaFintech Group including online trading, online transfers, deposit/withdrawal of funds, etc.

If you think you are seeing this message by mistake and your location is not the US, kindly proceed to the website. Otherwise, you must leave the website in order to comply with government restrictions.

Why does your IP address show your location as the USA?

  • - you are using a VPN provided by a hosting company based in the United States;
  • - your IP does not have proper WHOIS records;
  • - an error occurred in the WHOIS geolocation database.

Please confirm whether you are a US resident or not by clicking the relevant button below. If you choose the wrong option, being a US resident, you will not be able to open an account with InstaForex anyway.

We are sorry for any inconvenience caused by this message.