signal strength 1 of 5

According to the chart of M5, AUDCHF formed the Bearish Symmetrical Triangle pattern. Description: The lower border is 0.5164/0.5181 and upper border is 0.5203/0.5181. The pattern width is measured on the chart at -39 pips. The formation of the Bearish Symmetrical Triangle pattern evidently signals a continuation of the downward trend. In other words, if the scenario comes true and AUDCHF breaches the lower border, the price could continue its move toward 0.5166.
The M5 and M15 time frames may have more false entry points.
- All
- Double Top
- Flag
- Head and Shoulders
- Pennant
- Rectangle
- Triangle
- Triple top
- All
- #AAPL
- #AMZN
- #Bitcoin
- #EBAY
- #FB
- #GOOG
- #INTC
- #KO
- #MA
- #MCD
- #MSFT
- #NTDOY
- #PEP
- #TSLA
- #TWTR
- AUDCAD
- AUDCHF
- AUDJPY
- AUDUSD
- EURCAD
- EURCHF
- EURGBP
- EURJPY
- EURNZD
- EURRUB
- EURUSD
- GBPAUD
- GBPCHF
- GBPJPY
- GBPUSD
- GOLD
- NZDCAD
- NZDCHF
- NZDJPY
- NZDUSD
- SILVER
- USDCAD
- USDCHF
- USDJPY
- USDRUB
- All
- M5
- M15
- M30
- H1
- D1
- All
- Buy
- Sale
- All
- 1
- 2
- 3
- 4
- 5
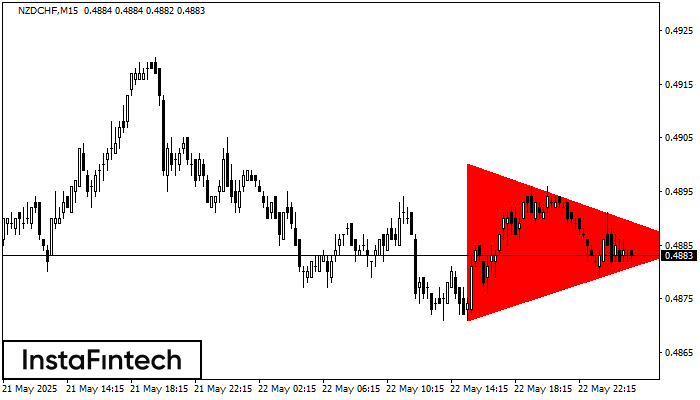
According to the chart of M15, NZDCHF formed the Bearish Symmetrical Triangle pattern. Trading recommendations: A breach of the lower border 0.4871 is likely to encourage a continuation
The M5 and M15 time frames may have more false entry points.
Open chart in a new window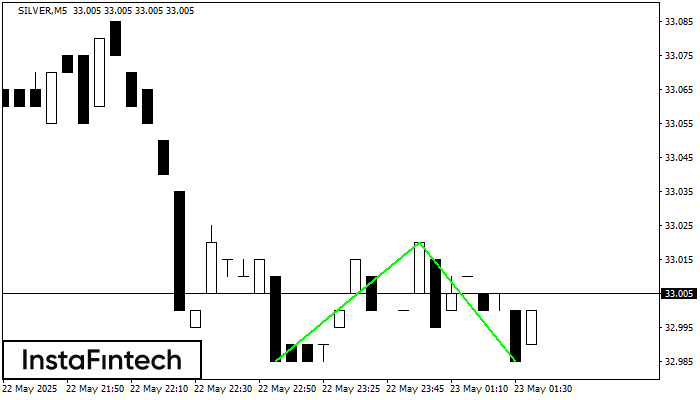
The Double Bottom pattern has been formed on SILVER M5. This formation signals a reversal of the trend from downwards to upwards. The signal is that a buy trade should
The M5 and M15 time frames may have more false entry points.
Open chart in a new window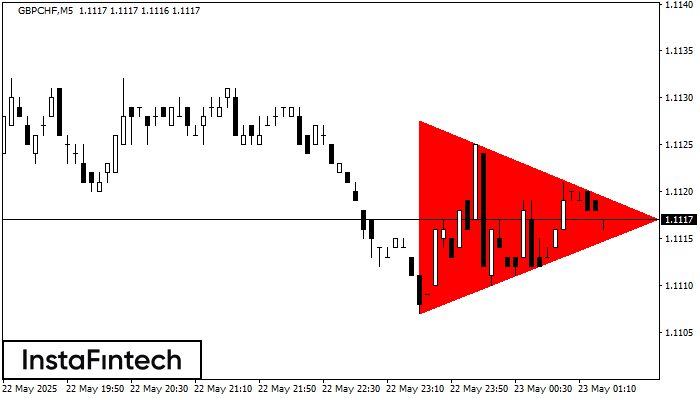
According to the chart of M5, GBPCHF formed the Bearish Symmetrical Triangle pattern. Trading recommendations: A breach of the lower border 1.1107 is likely to encourage a continuation
The M5 and M15 time frames may have more false entry points.
Open chart in a new window