signal strength 1 of 5

The Bullish Flag pattern has been formed on the chart EURUSD M5 which signals that the upward trend will continue. Signals: а break of the peak at 1.0836 may push the price higher, and the rise will be the projection of the pole.
The M5 and M15 time frames may have more false entry points.
See Also
- All
- Double Top
- Flag
- Head and Shoulders
- Pennant
- Rectangle
- Triangle
- Triple top
- All
- #AAPL
- #AMZN
- #Bitcoin
- #EBAY
- #FB
- #GOOG
- #INTC
- #KO
- #MA
- #MCD
- #MSFT
- #NTDOY
- #PEP
- #TSLA
- #TWTR
- AUDCAD
- AUDCHF
- AUDJPY
- AUDUSD
- EURCAD
- EURCHF
- EURGBP
- EURJPY
- EURNZD
- EURRUB
- EURUSD
- GBPAUD
- GBPCHF
- GBPJPY
- GBPUSD
- GOLD
- NZDCAD
- NZDCHF
- NZDJPY
- NZDUSD
- SILVER
- USDCAD
- USDCHF
- USDJPY
- USDRUB
- All
- M5
- M15
- M30
- H1
- D1
- All
- Buy
- Sale
- All
- 1
- 2
- 3
- 4
- 5
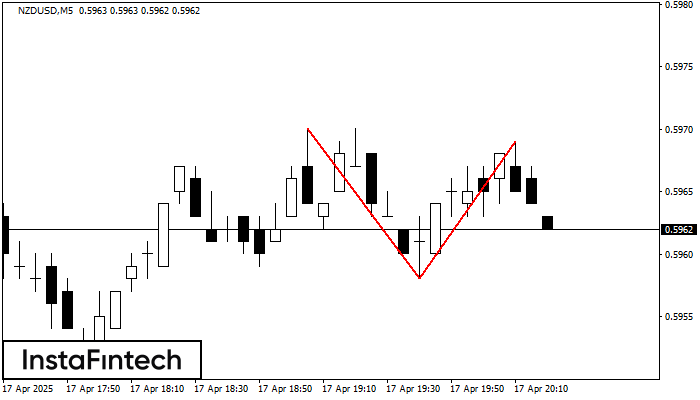
El patrón de reversión Doble Techo ha sido formado en NZDUSD M5. Características: el límite superior 0.5970; el límite inferior 0.5958; el ancho del patrón es 11 puntos. Es mejor
Los marcos de tiempo M5 y M15 pueden tener más puntos de entrada falsos.
Open chart in a new window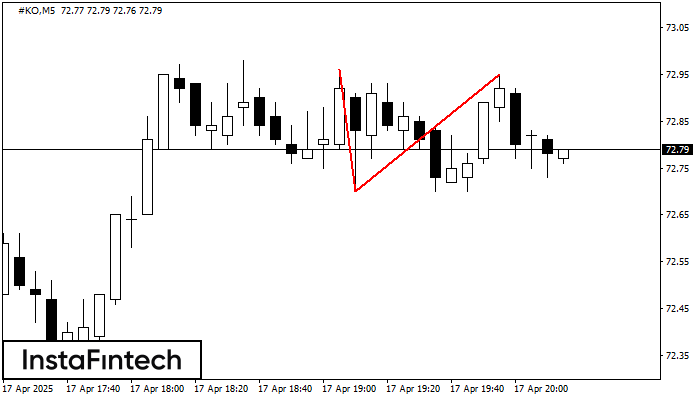
En el gráfico de #KO M5 el patrón de reversión Doble Techo ha sido formado. Características: límite superior 72.95; límite inferior 72.70; el ancho del patrón 25 puntos. La señal
Los marcos de tiempo M5 y M15 pueden tener más puntos de entrada falsos.
Open chart in a new window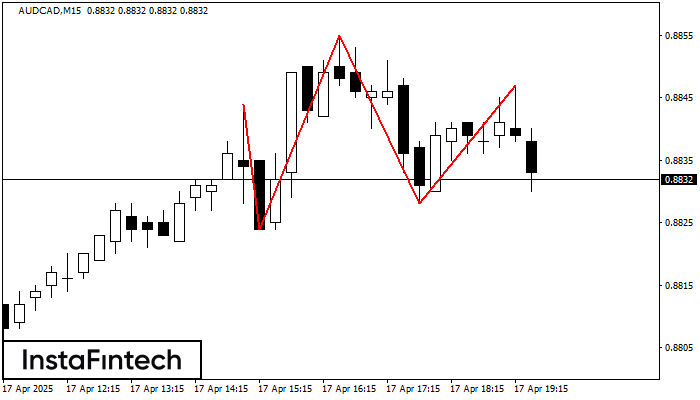
El AUDCAD M15 formó el patrón Cabeza y Hombros con las siguientes características: El techo de la Cabeza se encuentra en 0.8855, la línea de cuello y el ángulo alcista
Los marcos de tiempo M5 y M15 pueden tener más puntos de entrada falsos.
Open chart in a new window