


was formed on 09.04 at 11:59:50 (UTC+0)
signal strength 1 of 5
signal strength 1 of 5
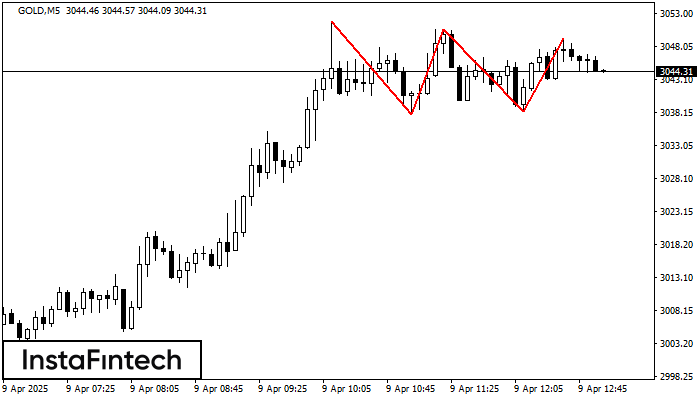
On the chart of the GOLD M5 trading instrument, the Triple Top pattern that signals a trend change has formed. It is possible that after formation of the third peak, the price will try to break through the resistance level 3037.74, where we advise to open a trading position for sale. Take profit is the projection of the pattern’s width, which is 1408 points.
The M5 and M15 time frames may have more false entry points.
Figure
- All
- Double Top
- Flag
- Head and Shoulders
- Pennant
- Rectangle
- Triangle
- Triple top
Instrument
- All
- #AAPL
- #AMZN
- #Bitcoin
- #EBAY
- #FB
- #GOOG
- #INTC
- #KO
- #MA
- #MCD
- #MSFT
- #NTDOY
- #PEP
- #TSLA
- #TWTR
- AUDCAD
- AUDCHF
- AUDJPY
- AUDUSD
- EURCAD
- EURCHF
- EURGBP
- EURJPY
- EURNZD
- EURRUB
- EURUSD
- GBPAUD
- GBPCHF
- GBPJPY
- GBPUSD
- GOLD
- NZDCAD
- NZDCHF
- NZDJPY
- NZDUSD
- SILVER
- USDCAD
- USDCHF
- USDJPY
- USDRUB
Timeframe
- All
- M5
- M15
- M30
- H1
- D1
Trend
- All
- Buy
- Sale
Signal Strength
- All
- 1
- 2
- 3
- 4
- 5


