signal strength 2 of 5

The Bearish Flag pattern has been formed on USDJPY at M15. The lower boundary of the pattern is located at 140.89/141.19 while the upper boundary lies at 141.19/141.49. The projection of the flagpole is 77 points. This formation signals that the downward trend is most likely to continue. Therefore, if the level of 140.89 is broken, the price will move further downwards.
The M5 and M15 time frames may have more false entry points.
- All
- Double Top
- Flag
- Head and Shoulders
- Pennant
- Rectangle
- Triangle
- Triple top
- All
- #AAPL
- #AMZN
- #Bitcoin
- #EBAY
- #FB
- #GOOG
- #INTC
- #KO
- #MA
- #MCD
- #MSFT
- #NTDOY
- #PEP
- #TSLA
- #TWTR
- AUDCAD
- AUDCHF
- AUDJPY
- AUDUSD
- EURCAD
- EURCHF
- EURGBP
- EURJPY
- EURNZD
- EURRUB
- EURUSD
- GBPAUD
- GBPCHF
- GBPJPY
- GBPUSD
- GOLD
- NZDCAD
- NZDCHF
- NZDJPY
- NZDUSD
- SILVER
- USDCAD
- USDCHF
- USDJPY
- USDRUB
- All
- M5
- M15
- M30
- H1
- D1
- All
- Buy
- Sale
- All
- 1
- 2
- 3
- 4
- 5
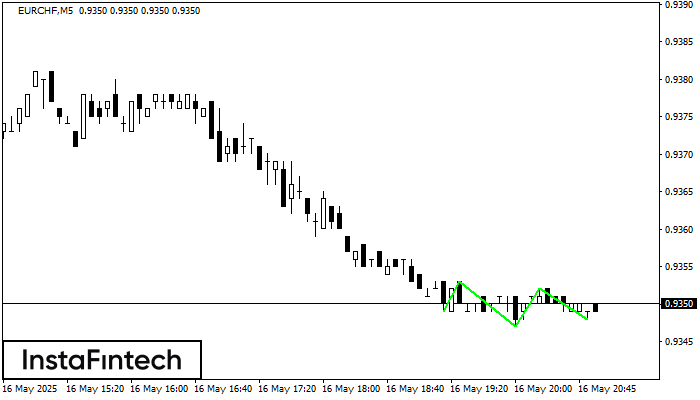
The Triple Bottom pattern has formed on the chart of EURCHF M5. Features of the pattern: The lower line of the pattern has coordinates 0.9353 with the upper limit 0.9353/0.9352
The M5 and M15 time frames may have more false entry points.
Open chart in a new window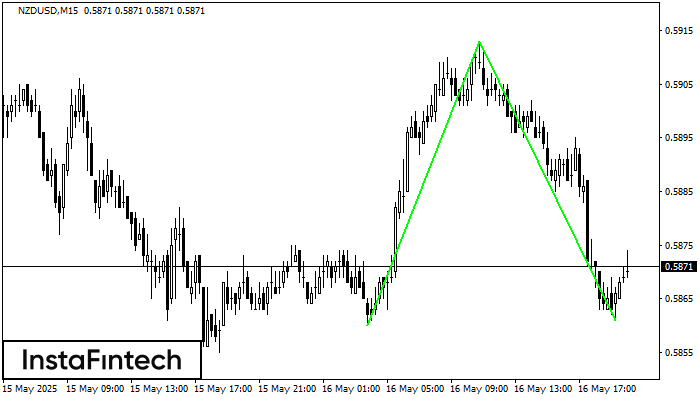
The Double Bottom pattern has been formed on NZDUSD M15. Characteristics: the support level 0.5860; the resistance level 0.5913; the width of the pattern 53 points. If the resistance level
The M5 and M15 time frames may have more false entry points.
Open chart in a new window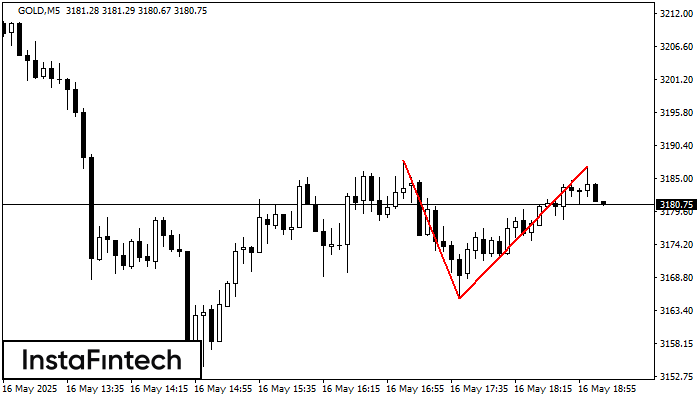
The Double Top reversal pattern has been formed on GOLD M5. Characteristics: the upper boundary 3187.99; the lower boundary 3165.48; the width of the pattern is 2143 points. Sell trades
The M5 and M15 time frames may have more false entry points.
Open chart in a new window