was formed on 24.04 at 21:08:21 (UTC+0)
signal strength 4 of 5
signal strength 4 of 5
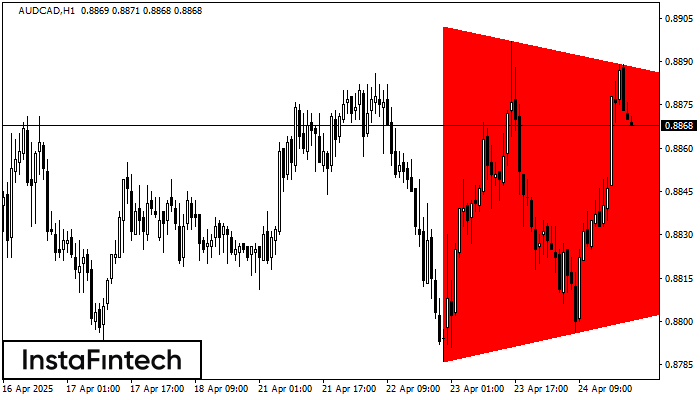
According to the chart of H1, AUDCAD formed the Bearish Symmetrical Triangle pattern. Trading recommendations: A breach of the lower border 0.8786 is likely to encourage a continuation of the downward trend.
See Also
Figure
- All
- Double Top
- Flag
- Head and Shoulders
- Pennant
- Rectangle
- Triangle
- Triple top
Instrument
- All
- #AAPL
- #AMZN
- #Bitcoin
- #EBAY
- #FB
- #GOOG
- #INTC
- #KO
- #MA
- #MCD
- #MSFT
- #NTDOY
- #PEP
- #TSLA
- #TWTR
- AUDCAD
- AUDCHF
- AUDJPY
- AUDUSD
- EURCAD
- EURCHF
- EURGBP
- EURJPY
- EURNZD
- EURRUB
- EURUSD
- GBPAUD
- GBPCHF
- GBPJPY
- GBPUSD
- GOLD
- NZDCAD
- NZDCHF
- NZDJPY
- NZDUSD
- SILVER
- USDCAD
- USDCHF
- USDJPY
- USDRUB
Timeframe
- All
- M5
- M15
- M30
- H1
- D1
Trend
- All
- Buy
- Sale
Signal Strength
- All
- 1
- 2
- 3
- 4
- 5
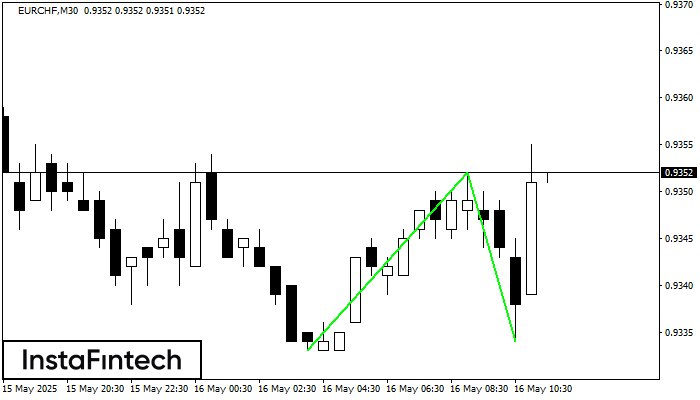
The Double Bottom pattern has been formed on EURCHF M30. Characteristics: the support level 0.9333; the resistance level 0.9352; the width of the pattern 19 points. If the resistance level
Open chart in a new window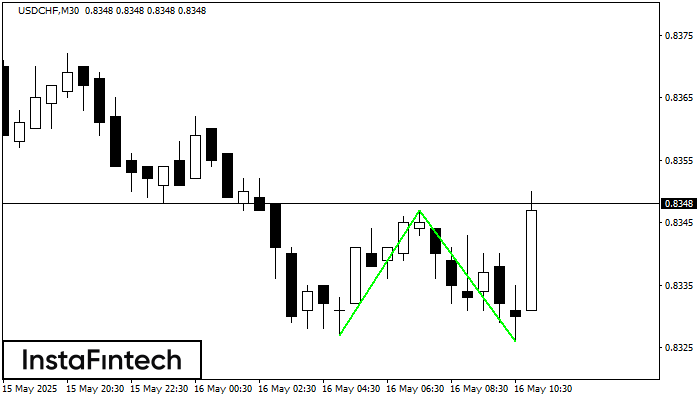
The Double Bottom pattern has been formed on USDCHF M30. Characteristics: the support level 0.8327; the resistance level 0.8347; the width of the pattern 20 points. If the resistance level
Open chart in a new window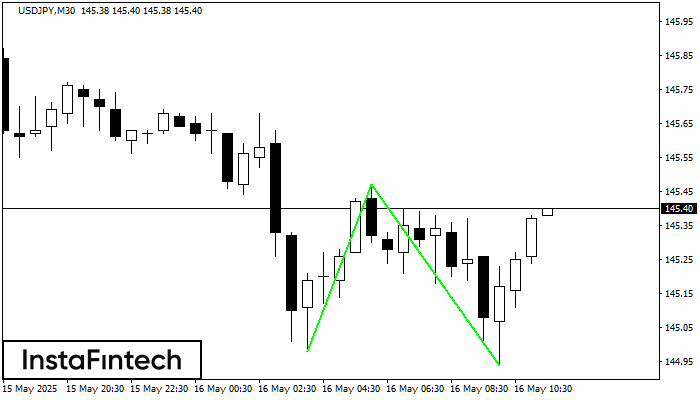
The Double Bottom pattern has been formed on USDJPY M30; the upper boundary is 145.47; the lower boundary is 144.94. The width of the pattern is 49 points. In case
Open chart in a new window