Minuettes operational scale (H4)
Waiting for a reversal? Here's the comprehensive analysis for the development options of the movement of the main currency instruments #USDX vs EUR/USD vs GBP/USD vs USD/JPY on March 24, 2020.
____________________
US dollar index
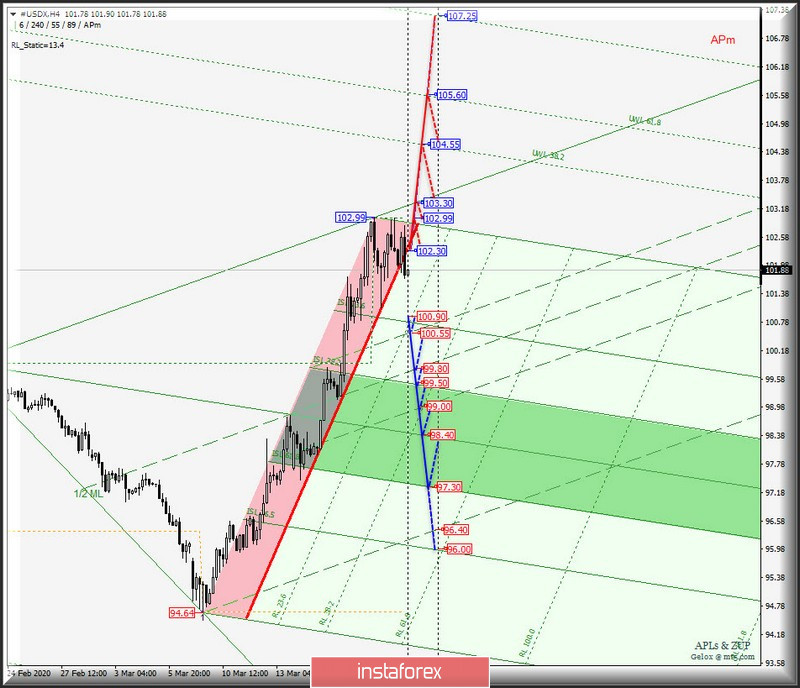
The movement of the dollar index #USDX from March 24, 2020 will be determined by the development and the breakdown direction of a fairly wide range:
- resistance level of 102.30 - boundary of the red zone of the Minuette operational scale forks;
- support level of 100.90 - signal line ISL23.6 of the Minuette operational scale forks.
The breakdown of the signal line ISL23.6 (support level of 100.90) Minuette will cause the movement of #USDX to be extended to the boundaries of the 1/2 Median Line channel (100.55 - 99.80 - 99.00) and equilibrium zone (99.50 - 98.40 - 97.30) of the Minuette operational scale forks.
On the contrary, if the dollar index returns (breakdown of the resistance level of 102.30) in the red zone of the Minuette operational scale forks, then the development of the upward movement can continue to the goals:
- maximum 102.99;
- control line UTL (103.30) of the Minuette operational scale forks;
- warning - UWL38.2 (104.55) and UWL61.8 (105.60) - lines of the Minuette operational scale forks.
The details of marking the movement of the dollar index from March 24, 2020 are presented on the animated chart.
____________________
Euro vs US dollar
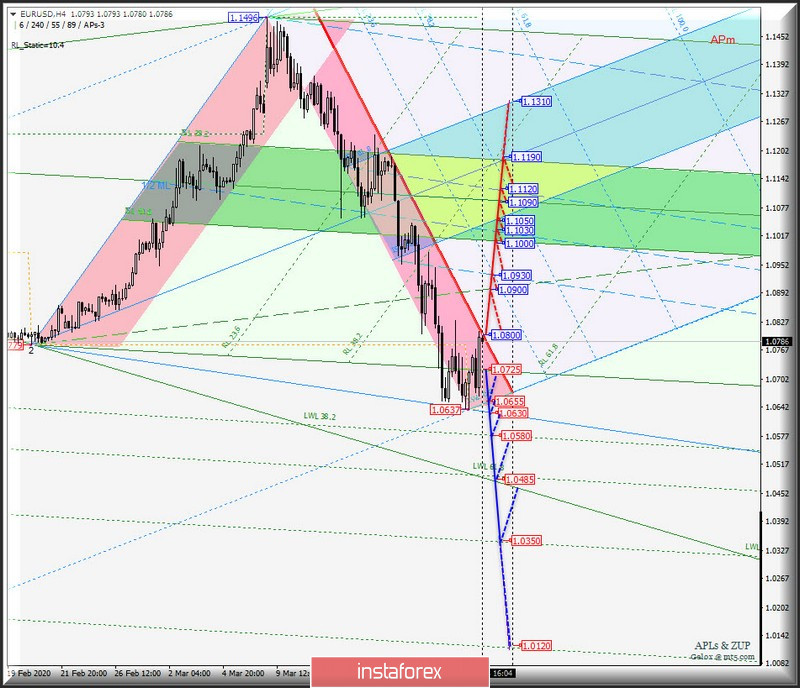
The movement of the single European currency EUR / USD from March 24, 2020 will also be determined by the direction of the breakdown of the range :
- resistance level of 1.0800 - boundary of a red zone of the Minuette operational scale forks;
- support level of 1.0725 on the FSL endpoint forks
The breakdown of the resistance level of 1.0800 at the boundary of the red zone of the Minuette operational scale forks will determine the development of the upward movement of the single European currency to the final Schiff Line Minuette (1.0900), the boundaries of the 1/2 Median Line Minuette channel (1.0930 - 1.1030 - 1.1120) and the equilibrium zone (1.1000 - 1.1090 - 1.1190) of the Minuette operational scale forks.
Alternatively, in the event of the breakdown of the FSL terminal line (support level of 1.0725) of the Minuette operational scale forks, then the EUR / USD movement can be continued to the initial SSL (1.0655) and control LTL (1.0630) lines of the Minuette operational scale forks with the prospect of reaching warning lines - LWL38.2 (1.0580) and LWL61.8 (1.0485) of the Minuette operational scale forks.
The details of the EUR / USD movement options are shown on the animated chart.
____________________
Great Britain pound vs US dollar
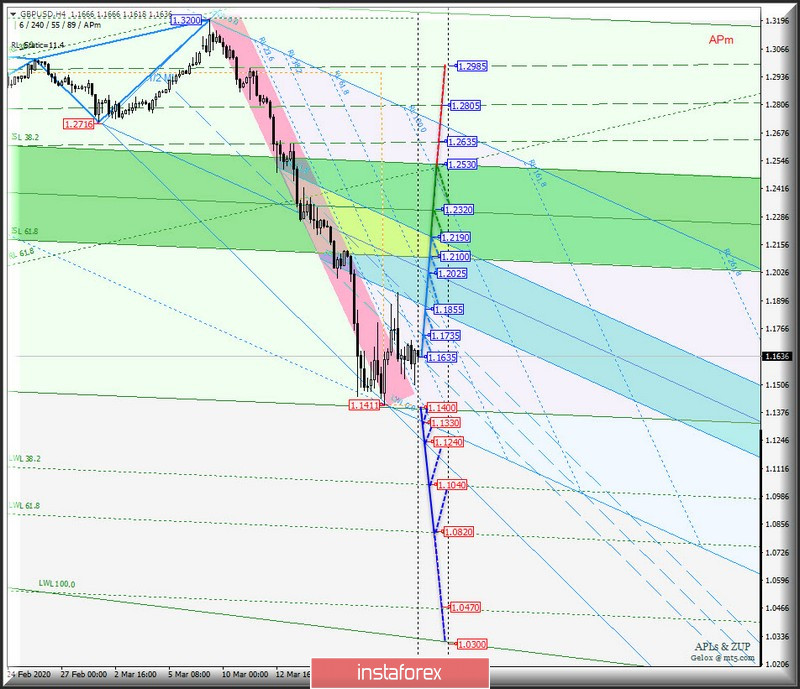
On March 24, 2020, Her Majesty's GBP / USD currency will continue to develop its movement depending on the development and the breakdown direction of the range:
- resistance level of 1.1635 - lower boundary of the 1/2 Median Line Minuette channel;
- support level of 1.1400 - final line FSL of the Minuette operational scale forks.
In case of breakdown of the resistance level of 1.1635, the development of Her Majesty's currency movement will continue in the a Median Line Minuette channel (1.1635 - 1.1735 - 1.1855) and within the boundaries of the equilibrium zones of the Minuette operational scale forks (1.1855 - 1.2025 - 1.2190) and Minuette (1.2100 - 1.2320 - 1.2530).
Meanwhile, the breakdown of the final line of the FSL (support level of 1.1400) of the Minuette operational scale forks will lead to an option to continue the development of the downward movement of GBP / USD to the initial SSL (1.1330) and the final LTL (1.1240) lines of the Minuette operational scale forks with the prospect of reaching the warning lines - LWL38.2 (1.1040) and LWL61.8 (1.0820) of the Minuette operational scale forks.
The details of the GBP / USD movement can be seen on the animated chart.
____________________
US dollar vs Japanese yen
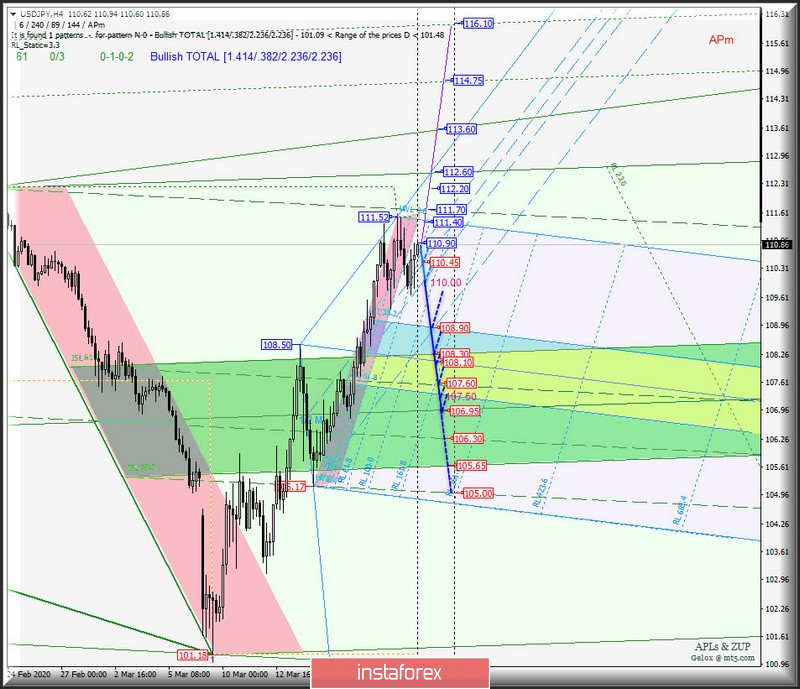
The development of the USD / JPY currency movement of the country of the rising sun from March 24, 2020 will be determined by the development and direction of the breakdown of the boundaries of 1/2 Median Line channel (110.90 - 110.45 - 110.00) of the Minuette operational scale forks. We look at the details of this movement on the chart.
The breakdown lower boundary (support level of 110.00) of the 1/2 Median Line Minuette channel will lead to an option to continue the development of the downward movement of USD / JPY to the boundaries of the equilibrium zones of the Minuette operational scale forks (108.90 - 108.10 - 107.50) and Minuette (108.30 - 106.95 - 105.65).
In contrast, the breakdown of the upper boundary (resistance level of 110.00) of the 1/2 Median Line Minuette channel will make it possible to continue the upward movement of the currency of the "land of the rising sun" to the goals:
- the initial line SSL Minuette (111.40);
- final Schiff Line Minuette (111.70);
- maximum 112.20;
- end line FSL Minuette (112.60);
- control line UTL Minuette (113.60).
We look at the details of the USD / JPY movement on the chart.
____________________
The review was compiled without taking into account the news background. Thus, the opening trading sessions of major financial centers does not serve as a guide to action (placing orders "sell" or "buy").
The formula for calculating the dollar index :
USDX = 50.14348112 * USDEUR0.576 * USDJPY0.136 * USDGBP0.119 * USDCAD0.091 * USDSEK0.042 * USDCHF0.036.
where power factors correspond to the weights of the currencies in the basket:
Euro - 57.6% ;
Yen - 13.6% ;
Pound Sterling - 11.9% ;
Canadian dollar - 9.1%;
Swedish krona - 4.2%;
Swiss franc - 3.6%.
The first coefficient in the formula leads the index to 100 at the starting date - March 1973, when the main currencies began to be freely quoted relative to each other.