empty
10.03.2025 09:49 AM
EUR/USD and GBP/USD March 10 – Technical Analysis

EUR/USD

This image is no longer relevant

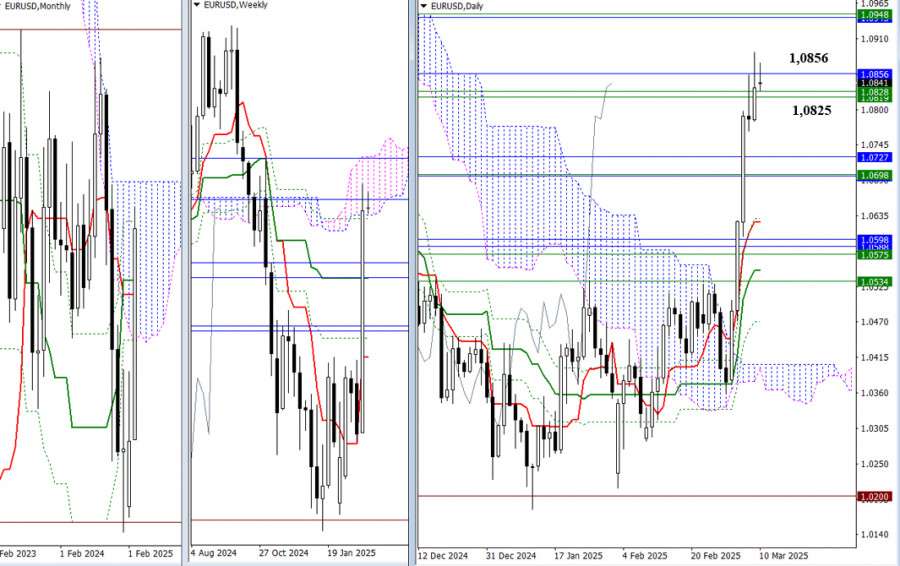
Last week, the EUR/USD pair closed within the weekly cloud, with the lower boundary at 1.0825. It reached the final level of the monthly Ichimoku cross at 1.0856. If the pair successfully overcomes these resistance levels, it will pave the way to the upper boundaries of the Ichimoku cloud at the monthly level (1.0943) and the weekly level (1.0948). Conversely, a rebound from the tested range of 1.0825 to 1.0856 could push the pair back toward previous clusters of resistance around 1.0727 to 1.0696, which align with the weekly medium-term trend as well as the monthly Tenkan and Kijun lines.

This image is no longer relevant

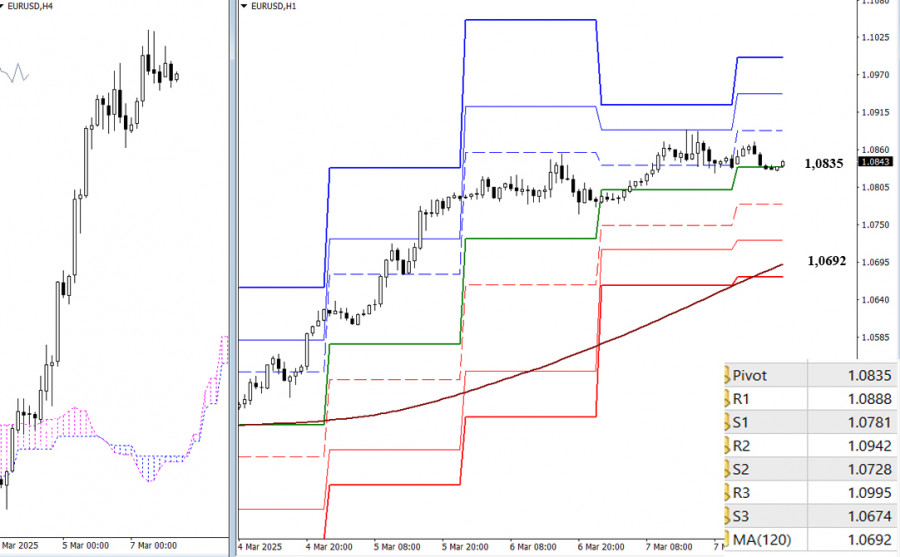
On lower timeframes, buyers currently hold the advantage. To maintain the upward movement, they need to break through the resistance at the classic Pivot levels for the day, which are positioned at 1.0888, 1.0942, and 1.0995. If the upward momentum fails, sellers may test the support levels at the classic Pivot points (1.0781 to 1.0728) before reaching the weekly long-term trend at 1.0692. This trend is crucial in determining the current balance of power, so a breakout and reversal below this level would enable sellers to plan for a longer-term downward move.

***

GBP/USD

This image is no longer relevant

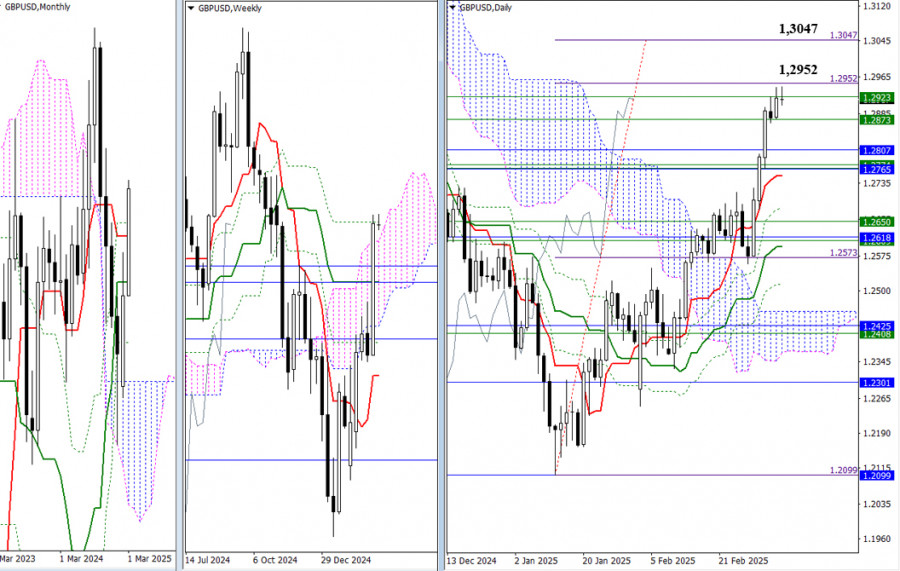
Buyers are currently facing a significant resistance zone. Although several levels have been surpassed, the target for a breakout, represented by the daily Ichimoku cloud (ranging from 1.2952 to 1.3047), remains a hurdle. A successful breakout and consolidation above this zone could lead to new bullish targets, including a potential rise to the nearest high at 1.3433. However, if buyers fail at this point, bearish activity could revert to the previously established support zone (between 1.2873 and 1.2751).

This image is no longer relevant

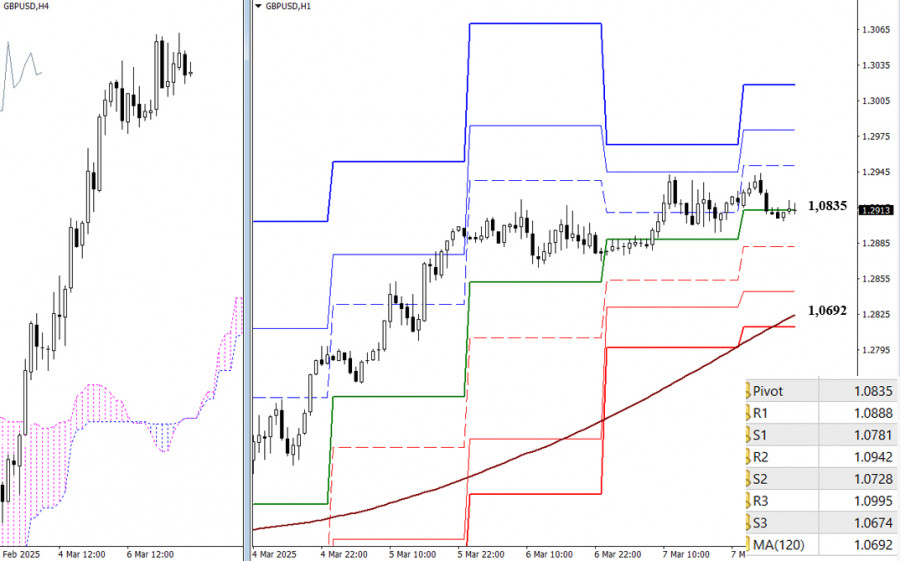
On lower timeframes, buyers are in a more favorable position. Key reference points for maintaining upward momentum throughout the day are located at the classic Pivot levels of 1.2950, 1.2981, and 1.3018. If a corrective decline occurs, the pair may find support at the classic Pivot levels (ranging from 1.2882 to 1.2845), followed by a longer-term weekly trend line at 1.0692. A breakout below this trend could shift the balance of power in favor of sellers.

***

Technical Analysis Components:
  • Higher Timeframes: Ichimoku Kinko Hyo (9.26.52) and Fibonacci Kijun levels
  • H1: Classic Pivot Points and 120-period Moving Average (weekly long-term trend)
Evangelos Poulakis,
انسٹافاریکس کا تجزیاتی ماہر
© 2007-2025
ٹائم فریم منتخب کریں
5
منٹ
15
منٹ
30
منٹ
1
گھنٹہ
4
گھنٹے
1
دن
1
ہفتہ
انسٹافاریکس کے ساتھ کرپٹو کرنسی کی معاملاتی تبدیلیوں سے کمائیں۔
میٹا ٹریڈر 4 ڈاؤن لوڈ کریں اور اپنی پہلی ٹریڈ کھولیں۔
  • Grand Choice
    Contest by
    InstaForex
    InstaForex always strives to help you
    fulfill your biggest dreams.
    مقابلہ میں شامل ہوں

تجویز کردہ مضامین

اپریل 30 2025 کے لیے یورو / یو ایس ڈی کے لیے تجارتی سگنل: 1.1376 سے نیچے فروخت کریں (21 ایس ایم اے - 7/8 مرے)

یورو 1.1370 کے ارد گرد کئی دنوں سے مستحکم ہو رہا ہے۔ امکان ہے کہ اس علاقے کے نیچے استحکام کمی کو تیز کر سکتا ہے، اور ہم توقع

Dimitrios Zappas 20:10 2025-04-30 UTC+2

اپریل 30 2025 کے لیے سونے (ایکس اے یو / یو ایس ڈی) کے لیے تجارتی اشارہ: $3,270 سے اوپر خریدیں (21 ایس ایم اے - 6/8 مرے)

امریکی سیشن کے شروع میں، سونا 3,384 کے ارد گرد ٹریڈ کر رہا ہے، کلیدی حمایت سے اوپر اور 3,267 تک پہنچنے کے بعد ری باؤنڈنگ۔ اگر سونے

Dimitrios Zappas 16:11 2025-04-30 UTC+2

اپریل 29-30 2025 کے لیے یورو / یو ایس ڈی کے لیے تجارتی سگنل: 1.1410 سے نیچے فروخت کریں (سماٹریکل مثلث - 7/8 مرے)

آنے والے گھنٹوں کے لیے ہمارا تجارتی منصوبہ 1.1370 اور 1.1230 پر اہداف کے ساتھ 1.1410 سے نیچے فروخت کرنا ہے۔ ایگل انڈیکیٹر منفی سگنل دے رہا ہے،

Dimitrios Zappas 18:57 2025-04-29 UTC+2

اپریل 29-30 2025 کے لیے سونے (ایکس اے یو / یو ایس ڈی) کے لیے تجارتی سگنل: $3,310 سے اوپر خریدیں (21 ایس ایم اے - 7/8 مرے)

ایگل انڈیکیٹر اوور سولڈ اشارے دکھا رہا ہے، لیکن ابھی بھی مزید کمی کا امکان موجود ہے، اس لیے کسی بھی تکنیکی ریباؤنڈ کو فروخت کرنے کے سگنل

Dimitrios Zappas 18:50 2025-04-29 UTC+2

اپریل 28-30 2025 کے لیے سونے (ایکس اے یو / یو ایس ڈی) کے لیے تجارتی سگنل: $3,270 سے اوپر خریدیں (21 ایس ایم اے - 7/8 مرے)

ایگل انڈیکیٹر اوور سولڈ اشارے دکھا رہا ہے، اس لیے ہمیں یقین ہے کہ سونا تکنیکی اصلاح کے بعد مختصر مدت میں اپنا تیزی کا چکر دوبارہ شروع کر سکتا

Dimitrios Zappas 18:35 2025-04-28 UTC+2

اپریل 28-30 2025 کے لیے یورو / یو ایس ڈی کے لیے تجارتی سگنل: 1.1370 سے نیچے فروخت (21 ایس ایم اے - 7/8 مرے)

دوسری طرف، اگر مندی کا دباؤ غالب رہتا ہے اور یورو 1.1370 سے نیچے مستحکم ہوتا ہے، تو اسے 1.1230 پر واقع 6/8 مرے پر اہداف کے ساتھ فروخت

Dimitrios Zappas 18:32 2025-04-28 UTC+2

اپریل 24-26 2025 کے لیے یورو / یو ایس ڈی کے لیے تجارتی سگنل: 1.1435 سے نیچے فروخت کریں (21 ایس ایم اے - 7/8 مرے)

آنے والے گھنٹوں کے لیے ہمارا ٹریڈنگ پلان یہ ہے کہ یورو کے 1.1429 یا 1.1435 کی مزاحمتی سطحوں تک بحال ہونے کا انتظار کیا جائے تاکہ وہاں سے فروخت

Dimitrios Zappas 20:02 2025-04-24 UTC+2

سونا : قریب میں سونے کی قیمتوں میں نمایاں کمی ہو سکتی ہے۔

امریکہ اور چین کے درمیان محصولات اور مجموعی تجارت پر حقیقی مذاکرات کے آغاز کی مارکیٹ کی توقعات کے درمیان سونے کی قیمتوں میں حال ہی میں قابل ذکر اصلاح

Pati Gani 17:09 2025-04-24 UTC+2

اپریل 15 2025 کو یورو / یو ایس ڈی کی پیشن گوئی

پیر کو، یورو / یو ایس ڈی جوڑا مسلسل بڑھتا رہا لیکن دن کے اختتام تک 1.1318 پر 261.8% فیبوناچی ریٹریسمنٹ کی سطح پر واپس آ گیا۔

Samir Klishi 16:02 2025-04-15 UTC+2

اپریل 15 2025 کو جی بی پی / یو ایس ڈی کی پیشن گوئی

فی گھنٹہ چارٹ پر، جی بی پی / یو ایس ڈی پئیر پیر کو بڑھتا رہا اور اس نے 1.3139 کی سطح سے اوپر کی پوزیشن حاصل کی۔ اس طرح،

Samir Klishi 15:50 2025-04-15 UTC+2
ابھی فوری بات نہیں کرسکتے ؟
اپنا سوال پوچھیں بذریعہ چیٹ.
Widget callback
 

Dear visitor,

Your IP address shows that you are currently located in the USA. If you are a resident of the United States, you are prohibited from using the services of InstaFintech Group including online trading, online transfers, deposit/withdrawal of funds, etc.

If you think you are seeing this message by mistake and your location is not the US, kindly proceed to the website. Otherwise, you must leave the website in order to comply with government restrictions.

Why does your IP address show your location as the USA?

  • - you are using a VPN provided by a hosting company based in the United States;
  • - your IP does not have proper WHOIS records;
  • - an error occurred in the WHOIS geolocation database.

Please confirm whether you are a US resident or not by clicking the relevant button below. If you choose the wrong option, being a US resident, you will not be able to open an account with InstaForex anyway.

We are sorry for any inconvenience caused by this message.