empty
28.03.2025 11:48 AM
EUR/USD. March 28th. Bears Retreat, but Haven't Surrendered

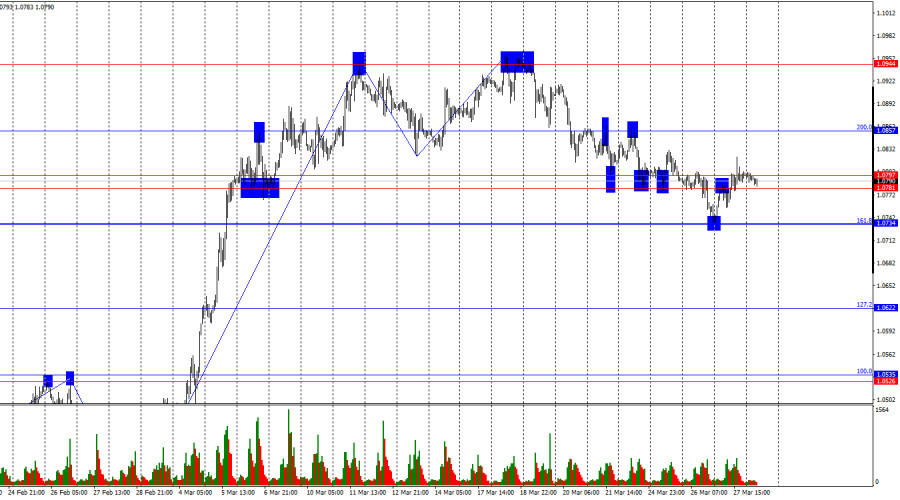
On Thursday, the EUR/USD pair rebounded from the 161.8% Fibonacci retracement level at 1.0734 and rose to the resistance zone of 1.0781–1.0797. A rebound from this zone would favor the U.S. dollar and a renewed decline toward 1.0734. A breakout and consolidation above this zone would allow the euro to continue rising toward the next Fibonacci level of 200.0% at 1.0857.

This image is no longer relevant

The wave structure on the hourly chart has changed. The last completed upward wave broke the previous peak by just a few points, while the last downward wave broke the previous low. This suggests a gradual trend reversal in a bearish direction. Donald Trump's tariffs have put strong pressure on the dollar over the past few weeks, but the market has reacted rather weakly to the latest round of tariffs.

Thursday's news background was important, but not in the way traders had hoped. Overnight, it was announced that Donald Trump had imposed 25% tariffs on all imported cars, rendering the rest of the day's events irrelevant for market participants. The dollar remained under pressure all day, even despite stronger-than-expected U.S. GDP data. Countries affected by the new tariffs, especially the European Union, are likely preparing a response. We are clearly in the midst of a trade war. However, traders are no longer rushing to sell the dollar. While the dollar fell all day yesterday, the decline was not particularly strong. The market is gradually coming to terms with the new reality, which implies that more rounds of tariffs from the U.S. are likely. If the dollar falls with each new round, it could soon drop to around 1.20. Still, the dollar's value should be influenced by more than just Trump—and the market understands that. As mentioned, the U.S. GDP report beat expectations.

This image is no longer relevant

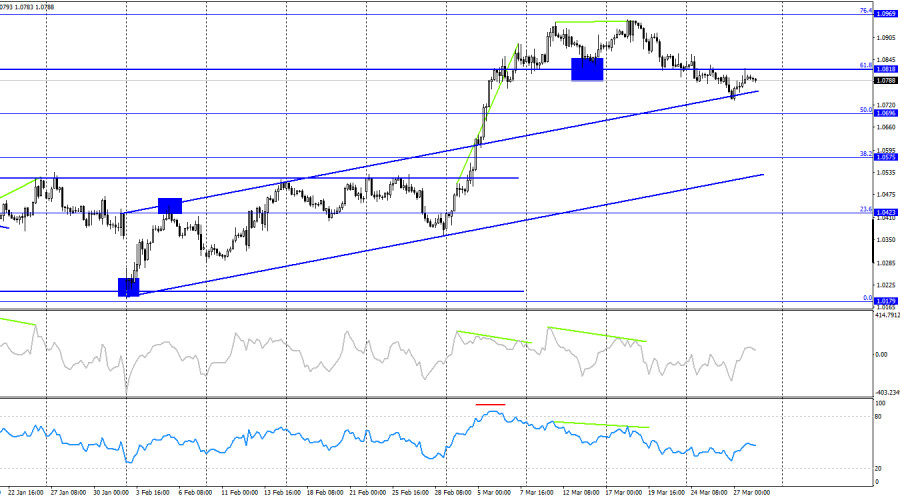
On the 4-hour chart, the pair reversed in favor of the U.S. dollar following the formation of another bearish divergence and a consolidation below the 61.8% Fibonacci level at 1.0818. This suggests continued decline toward the next retracement level at 50.0% – 1.0696. The euro still has room to fall, as the price remains above the upward trend channel. No emerging divergences are currently observed on any indicator.

Commitments of Traders (COT) Report:

This image is no longer relevant

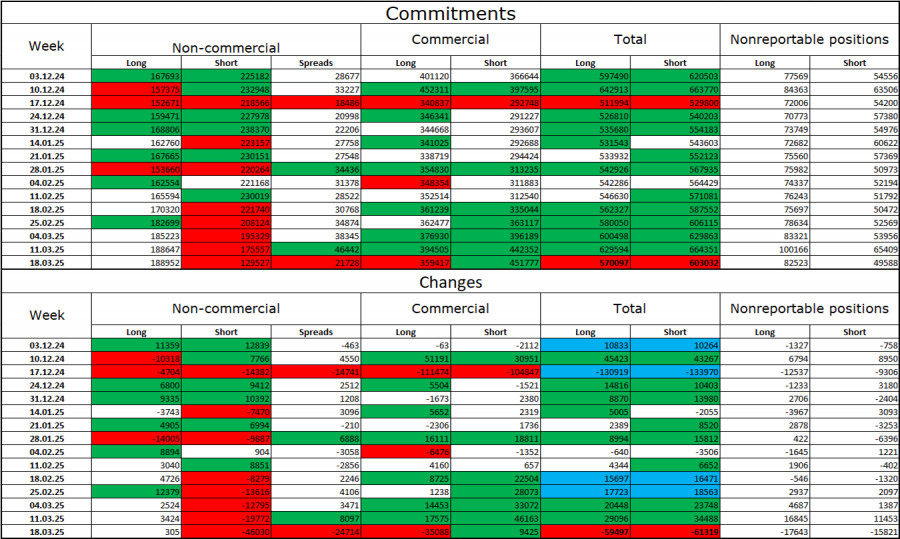
During the most recent reporting week, professional traders opened 305 long positions and closed 46,030 short positions. The "Non-commercial" group's sentiment has once again turned bullish—thanks to Donald Trump. The total number of long positions held by speculators now stands at 189,000, while short positions have dropped to 129,000.

For twenty consecutive weeks, large players were shedding euro positions, but they've now been reducing short positions and increasing long ones for six straight weeks. The diverging paths in monetary policy between the ECB and the Fed still favor the U.S. dollar due to the widening interest rate differential. However, Trump's policy is a stronger factor for traders, as it could have a dovish effect on the FOMC and even lead to a recession in the U.S. economy.

Economic Calendar for the U.S. and the Eurozone:

  • Eurozone – Germany Unemployment Rate (08:55 UTC)
  • U.S. – PCE Price Index (12:30 UTC)
  • U.S. – Personal Income and Spending (12:30 UTC)
  • U.S. – University of Michigan Consumer Sentiment Index (14:00 UTC)

On March 28, the economic calendar includes four events, none of which are considered highly important. As a result, the impact of news flow on market sentiment on Friday may be limited.

EUR/USD Forecast and Trading Tips:

Selling the pair was possible after a close below the 1.0781–1.0797 zone, targeting 1.0734 and 1.0622. The first target has been reached. Today, short positions can be considered on a bounce from the 1.0781–1.0797 zone with the same targets. Long positions may be considered on an hourly close above this zone, targeting 1.0857, but for now, bears remain in control.

Fibonacci levels are plotted from 1.0529 to 1.0213 on the hourly chart and from 1.1214 to 1.0179 on the 4-hour chart.

Samir Klishi,
انسٹافاریکس کا تجزیاتی ماہر
© 2007-2025
انسٹافاریکس کے ساتھ کرپٹو کرنسی کی معاملاتی تبدیلیوں سے کمائیں۔
میٹا ٹریڈر 4 ڈاؤن لوڈ کریں اور اپنی پہلی ٹریڈ کھولیں۔
  • Grand Choice
    Contest by
    InstaForex
    InstaForex always strives to help you
    fulfill your biggest dreams.
    مقابلہ میں شامل ہوں

تجویز کردہ مضامین

مئی 19-21 2025 کے لیے سونے کے لیے تجارتی سگنل: $3,247 سے نیچے فروخت (200 ای ایم اے - گیپ)

سونا 8 مئی کو 3,325 کے قریب ایک اور فرق چھوڑ گیا اور 3,250 سے اوپر ٹوٹنے کا امکان ہے۔ آؤٹ لک تیزی کا ہو سکتا ہے، اور ہم توقع

Dimitrios Zappas 20:05 2025-05-19 UTC+2

مئی 19-21 2025 کے لیے یورو / یو ایس ڈی کے لیے تجارتی سگنل: 1.1285 سے نیچے فروخت (200 ای ایم اے - گیپ)

آنے والے گھنٹوں کے لیے ہمارا تجارتی منصوبہ ڈاؤن ٹرینڈ چینل کے اوپری حصے سے نیچے یورو کو فروخت کرنا ہے، جس کے اہداف 1.1189 ہیں، اور پچھلے ہفتے 1.1150

Dimitrios Zappas 20:02 2025-05-19 UTC+2

یورو / یو ایس ڈی : تجزیہ اور پیشن گوئی

نئے ہفتے کے آغاز میں، یورو / یو ایس ڈی پئیر نے کمزور امریکی ڈالر کی پشت پر اوپر کی رفتار حاصل کی ہے۔ تکنیکی نقطہ نظر سے، 4 گھنٹے

Irina Yanina 20:01 2025-05-19 UTC+2

مئی 16-19 2025 کے لیے یورو / یو ایس ڈی کے لیے تجارتی سگنل: 1.1230 سے نیچے فروخت کریں (200 ای ایم اے - 6/8 مرے)

امکان ہے کہ آنے والے گھنٹوں میں یورو / یو ایس ڈی پئیر گرتا رہے گا اور اگلے ہفتے 1.0986 کے آس پاس 5/8 مرے تک بھی پہنچ سکتا ہے۔

Dimitrios Zappas 19:04 2025-05-16 UTC+2

مئی 16-19 2025 کے لیے سونے کے لیے تجارتی سگنل: $3,211 -3,226 (200 ای ایم اے - 21 ایس ایم اے) سے نیچے فروخت

ایگل انڈیکیٹر اوور سیلڈ لیول تک پہنچ رہا ہے۔ لہذا، ہمارا ماننا ہے کہ جب تک سونے کی قیمت 4/8 مرے کی سطح سے اوپر رہے گی کوئی

Dimitrios Zappas 19:02 2025-05-16 UTC+2

جی بی پی / یو ایس ڈی کی پیشن گوئی برائے 16 مئی

گھنٹہ وار چارٹ پر، جمعرات کو جی بی پی / یو ایس ڈی جوڑی ایک بار پھر برطانوی پاؤنڈ کے حق میں پلٹ گئی اور 1.3344–1.3357 کے مزاحمتی

Samir Klishi 15:54 2025-05-16 UTC+2

امریکی ڈالر اندیکس {ڈی ایکس وائے} تجزیہ اور پیشن گوئی

امریکی ڈالر انڈیکس، جو بڑی کرنسیوں کی ٹوکری کے مقابلے میں امریکی ڈالر کی کارکردگی کو ٹریک کرتا ہے، مسلسل دوسرے دن بھی مندی کے تعصب کے ساتھ تجارت جاری

Irina Yanina 15:50 2025-05-16 UTC+2

یو ایس ڈی / سی اے ڈی : تجزیہ اور پیشن گوئی

جمعہ تک، یو ایس ڈی / سی اے ڈی پئیر مسلسل دوسرے دن دباؤ میں ہے، جو منفی عوامل کے امتزاج سے کارفرما ہے۔ کل کے متوقع سے کمزور امریکی

Irina Yanina 15:42 2025-05-16 UTC+2

یورو / یو ایس ڈی کی پیشن گوئی برائے 15 مئی 2025

بدھ کے روز، یورو / یو ایس ڈی پئیر 1.1265–1.1282 کے مزاحمتی زون کی طرف بڑھ گیا، اس سے باز آ گیا، اور امریکی ڈالر کے حق میں پلٹ گیا،

Samir Klishi 17:19 2025-05-15 UTC+2

مئی 15-19 2025 کے لیے سونے کے لیے تجارتی سگنل: $3,222 سے اوپر خریدیں یا $3,203 سے نیچے فروخت کریں (200 ای ایم اے - 5/8 مرے)

یہ کہ 3,203 سے اوپر کا فیصلہ کن بریک تنزلی کے رجحان کے خاتمے کا اشارہ دے سکتا ہے اور سونے کے لیے تیزی کے نئے دور کا آغاز

Dimitrios Zappas 17:14 2025-05-15 UTC+2
ابھی فوری بات نہیں کرسکتے ؟
اپنا سوال پوچھیں بذریعہ چیٹ.
Widget callback
 

Dear visitor,

Your IP address shows that you are currently located in the USA. If you are a resident of the United States, you are prohibited from using the services of InstaFintech Group including online trading, online transfers, deposit/withdrawal of funds, etc.

If you think you are seeing this message by mistake and your location is not the US, kindly proceed to the website. Otherwise, you must leave the website in order to comply with government restrictions.

Why does your IP address show your location as the USA?

  • - you are using a VPN provided by a hosting company based in the United States;
  • - your IP does not have proper WHOIS records;
  • - an error occurred in the WHOIS geolocation database.

Please confirm whether you are a US resident or not by clicking the relevant button below. If you choose the wrong option, being a US resident, you will not be able to open an account with InstaForex anyway.

We are sorry for any inconvenience caused by this message.