signal strength 4 of 5
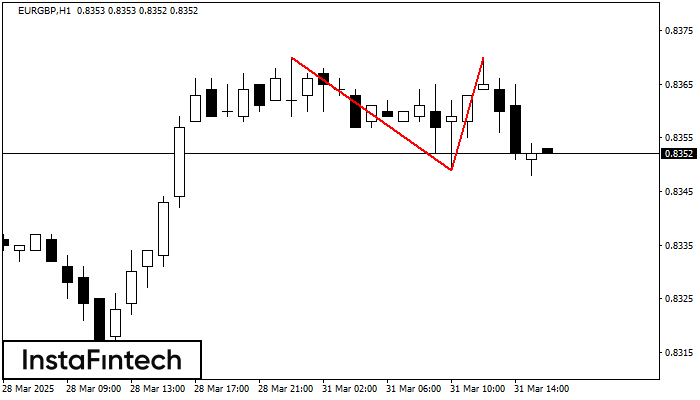
On the chart of EURGBP H1 the Double Top reversal pattern has been formed. Characteristics: the upper boundary 0.8370; the lower boundary 0.8349; the width of the pattern 21 points. The signal: a break of the lower boundary will cause continuation of the downward trend targeting the 0.8309 level.
- All
- Double Top
- Flag
- Head and Shoulders
- Pennant
- Rectangle
- Triangle
- Triple top
- All
- #AAPL
- #AMZN
- #Bitcoin
- #EBAY
- #FB
- #GOOG
- #INTC
- #KO
- #MA
- #MCD
- #MSFT
- #NTDOY
- #PEP
- #TSLA
- #TWTR
- AUDCAD
- AUDCHF
- AUDJPY
- AUDUSD
- EURCAD
- EURCHF
- EURGBP
- EURJPY
- EURNZD
- EURRUB
- EURUSD
- GBPAUD
- GBPCHF
- GBPJPY
- GBPUSD
- GOLD
- NZDCAD
- NZDCHF
- NZDJPY
- NZDUSD
- SILVER
- USDCAD
- USDCHF
- USDJPY
- USDRUB
- All
- M5
- M15
- M30
- H1
- D1
- All
- Buy
- Sale
- All
- 1
- 2
- 3
- 4
- 5
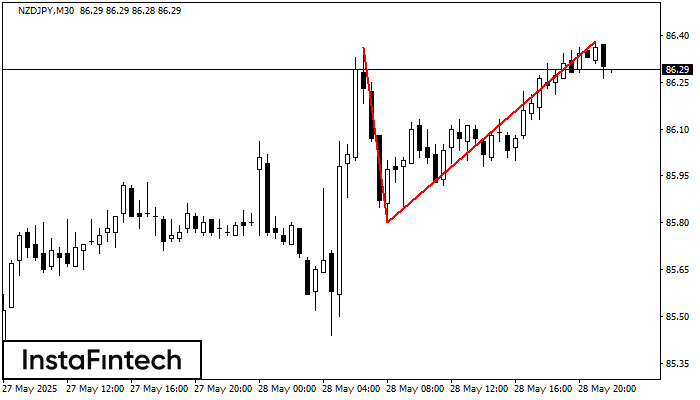
On the chart of NZDJPY M30 the Double Top reversal pattern has been formed. Characteristics: the upper boundary 86.38; the lower boundary 85.80; the width of the pattern 58 points
Open chart in a new window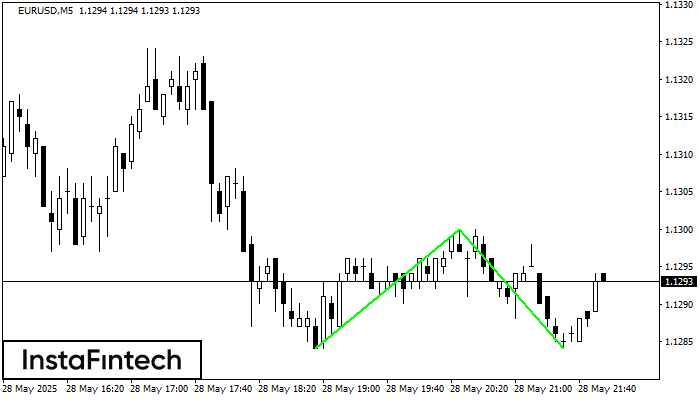
The Double Bottom pattern has been formed on EURUSD M5. Characteristics: the support level 1.1284; the resistance level 1.1300; the width of the pattern 16 points. If the resistance level
The M5 and M15 time frames may have more false entry points.
Open chart in a new window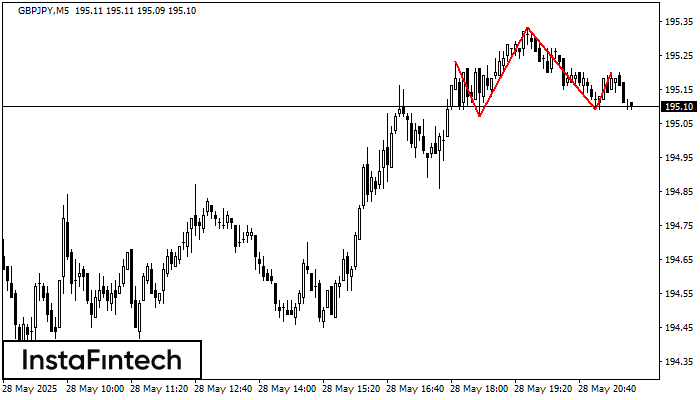
According to the chart of M5, GBPJPY formed the Head and Shoulders pattern. The Head’s top is set at 195.33 while the median line of the Neck is found
The M5 and M15 time frames may have more false entry points.
Open chart in a new window