signal strength 4 of 5

According to the chart of H1, #Bitcoin formed the Bearish Rectangle. This type of a pattern indicates a trend continuation. It consists of two levels: resistance 84685.39 - 0.00 and support 81178.46 – 81178.46. In case the resistance level 81178.46 - 81178.46 is broken, the instrument is likely to follow the bearish trend.
یہ بھی دیکھیں
- All
- Double Top
- Flag
- Head and Shoulders
- Pennant
- Rectangle
- Triangle
- Triple top
- All
- #AAPL
- #AMZN
- #Bitcoin
- #EBAY
- #FB
- #GOOG
- #INTC
- #KO
- #MA
- #MCD
- #MSFT
- #NTDOY
- #PEP
- #TSLA
- #TWTR
- AUDCAD
- AUDCHF
- AUDJPY
- AUDUSD
- EURCAD
- EURCHF
- EURGBP
- EURJPY
- EURNZD
- EURRUB
- EURUSD
- GBPAUD
- GBPCHF
- GBPJPY
- GBPUSD
- GOLD
- NZDCAD
- NZDCHF
- NZDJPY
- NZDUSD
- SILVER
- USDCAD
- USDCHF
- USDJPY
- USDRUB
- All
- M5
- M15
- M30
- H1
- D1
- All
- Buy
- Sale
- All
- 1
- 2
- 3
- 4
- 5
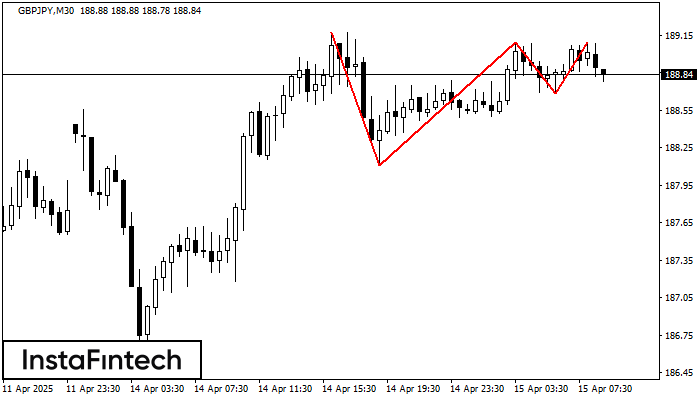
On the chart of the GBPJPY M30 trading instrument, the Triple Top pattern that signals a trend change has formed. It is possible that after formation of the third peak
Open chart in a new window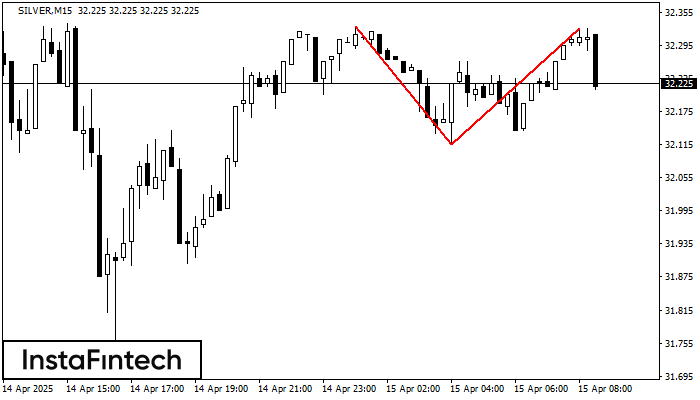
The Double Top pattern has been formed on SILVER M15. It signals that the trend has been changed from upwards to downwards. Probably, if the base of the pattern 32.12
The M5 and M15 time frames may have more false entry points.
Open chart in a new window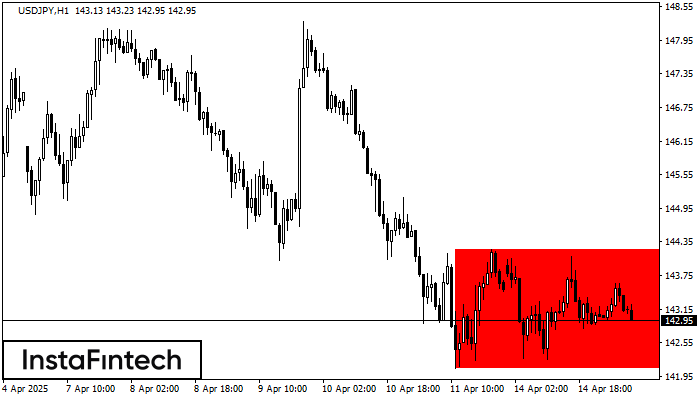
According to the chart of H1, USDJPY formed the Bearish Rectangle. The pattern indicates a trend continuation. The upper border is 144.21, the lower border is 142.08. The signal means
Open chart in a new window