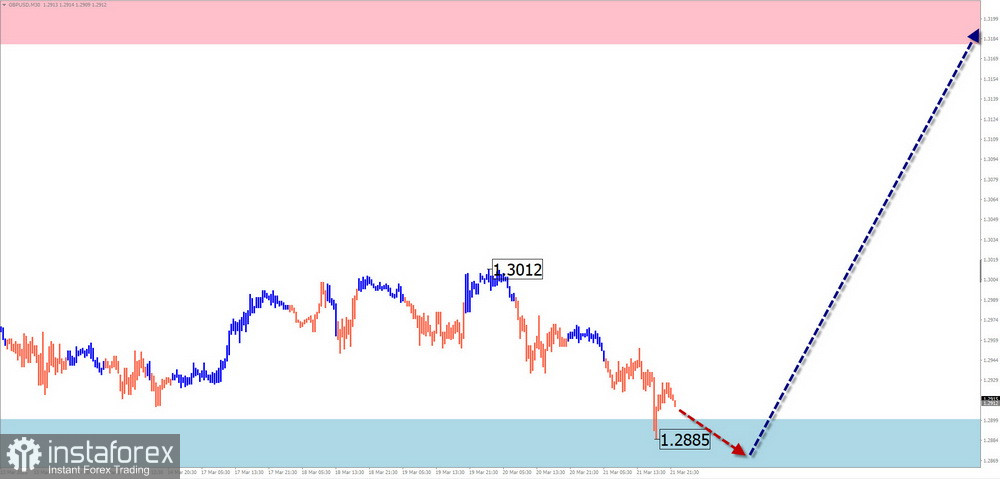
GBP/USD
Analysis: The daily chart of the British currency pair shows an ongoing bullish wave structure since January 13 of this year. The middle part of the wave (B) has been developing in recent weeks. The pair is forming a contracting flat pattern, which remains incomplete.
Forecast: Expect a sideways, flat tone in GBP's movement. Pressure on the lower support boundary is possible, followed by stabilization and potential for a bullish reversal. A resumption of upward momentum is more likely toward the weekend.
Potential Reversal Zones
- Resistance: 1.3180 / 1.3230
- Support: 1.2900 / 1.2850
Recommendations:
- Selling: No potential; likely to result in losses.
- Buying: May become the primary strategy once confirmed reversal signals appear near the support zone.
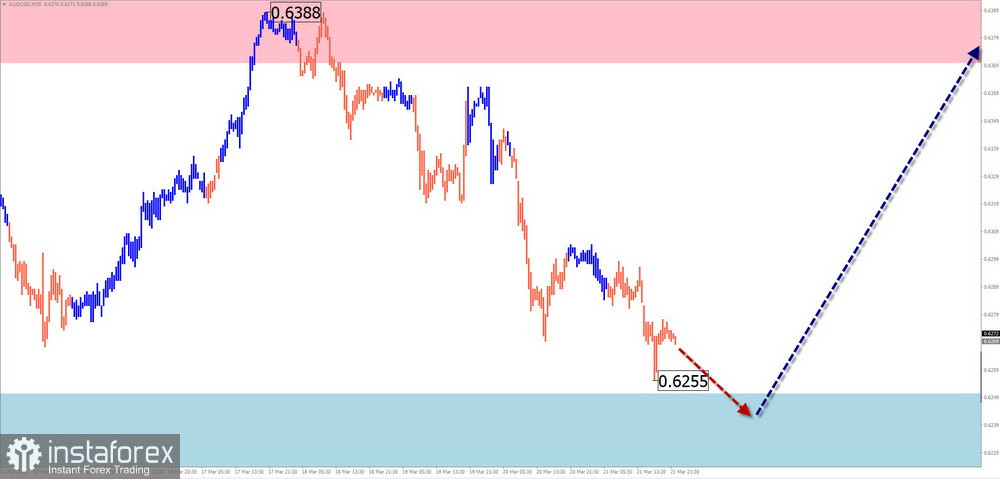
AUD/USD
Analysis: The bullish wave that began in February continues its formation. The middle corrective section (B) is still in progress and is taking shape as an extended flat correction.
Forecast: A downward tone is likely over the next couple of days, with pressure on the lower support boundary. Toward the weekend, volatility is expected to rise, followed by a possible trend reversal and price growth.
Potential Reversal Zones
- Resistance: 0.6370 / 0.6420
- Support: 0.6250 / 0.6200
Recommendations:
- Selling: Possible with reduced volume size within individual sessions until the first reversal signals.
- Buying: Can be considered after relevant signals appear near the support zone.
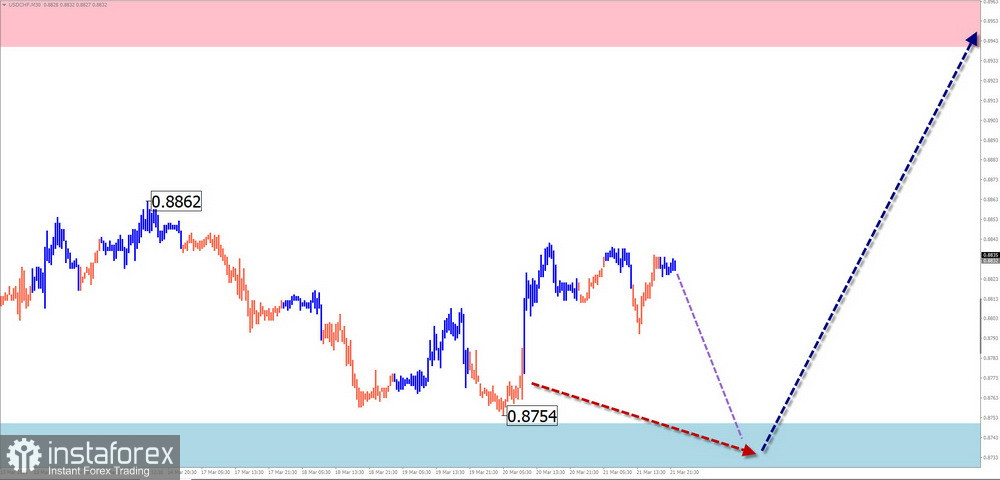
USD/CHF
Analysis: The ongoing bullish wave from August shows an incomplete corrective segment (B). The price is near the upper edge of a major support zone. A reversal wave structure must form before the next upward movement.
Forecast: Expect sideways movement with a downward bias in the coming days, potentially reaching support. Volatility may increase near the weekend, along with a potential bullish reversal.
Potential Reversal Zones
- Resistance: 0.8940 / 0.8990
- Support: 0.8750 / 0.8700
Recommendations:
- Selling: Possible with reduced volumes in select sessions.
- Buying: May be used after confirmed reversal signals near support from your trading system.
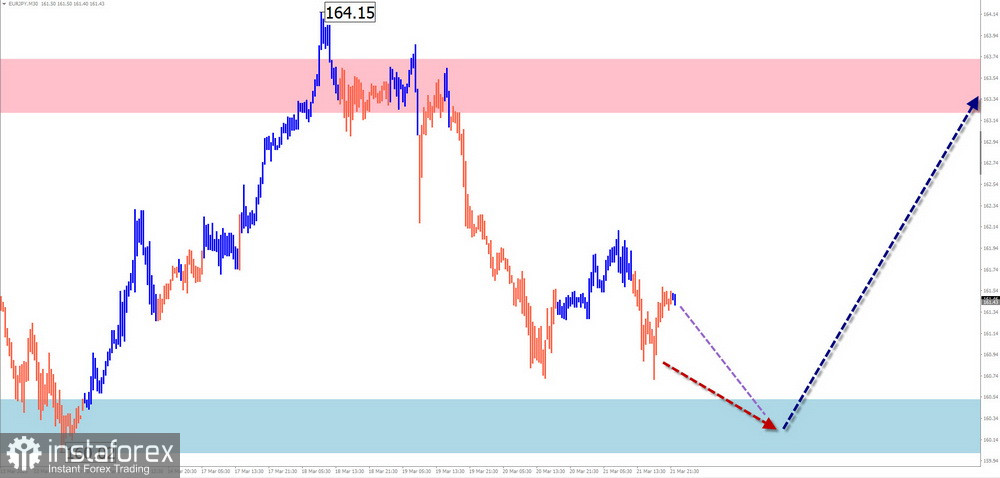
EUR/JPY
Analysis: The ongoing short-term bullish wave began in late February. Since early March, a sideways correction has been forming. The wave structure remains incomplete. The price is now near the lower boundary of a major daily timeframe reversal zone.
Forecast: Price is expected to fluctuate between opposing zones during the week. A downward move is more likely at the beginning of the week, with the possibility of a reversal and upward movement later.
Potential Reversal Zones
- Resistance: 163.20 / 163.70
- Support: 160.50 / 160.00
Recommendations:
- Selling: Can be used with fractional volumes during select sessions.
- Buying: Viable after confirmed reversal signals appear near the support zone.
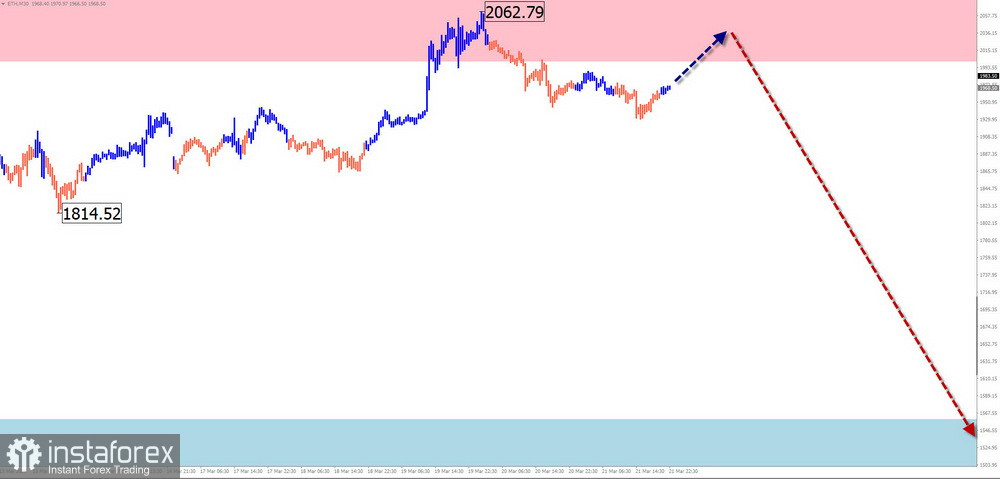
#Ethereum
Analysis: The dominant trend in Ethereum since December remains a downward wave. The wave is impulsive. After breaking strong support, the price entered sideways drift over the last two weeks, forming wave (B). It is moving along the lower boundary of the newly formed resistance zone.
Forecast: Expect sideways drifting to continue along the resistance zone in the next few days. Reversal signals may appear later, with higher volatility toward the end of the week. A brief breakout of resistance before reversal is possible.
Potential Reversal Zones
- Resistance: 2000.0 / 2050.0
- Support: 1560.0 / 1510.0
Recommendations:
- Buying: Low potential; likely to result in losses.
- Selling: Becomes relevant after confirmed reversal signals appear near resistance.
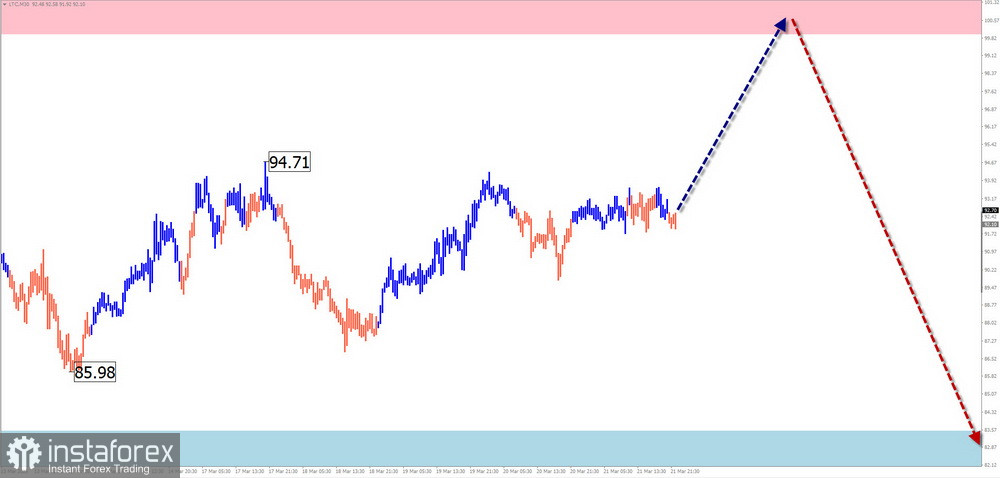
#Litecoin
Analysis: Litecoin has been forming a downward wave model since February. A corrective wave (B) began on March 11. The price is forming a contracting flat, after which the decline is expected to resume.
Forecast: Expect a flat upward move over the next few days, potentially reaching the resistance zone. A renewed decline is expected closer to the weekend. Support outlines the lower boundary of the week's range.
Potential Reversal Zones
- Resistance: 100.00 / 102.00
- Support: 83.50 / 81.50
Recommendations:
- Buying: Suitable intraday, but potential is limited by resistance.
- Selling: Becomes the main strategy once reversal signals appear near resistance.
Notes: In Simplified Wave Analysis (SWA), all waves consist of 3 parts (A-B-C). Only the last incomplete wave is analyzed per timeframe. Dotted lines indicate expected price movement.
Important: The wave algorithm does not account for the duration of price movements over time.