Actual patterns
Patterns are graphical models which are formed in the chart by the price. According to one of the technical analysis postulates, history (price movement) repeats itself. It means that the price movements are often similar in the same situations which makes it possible to predict the further development of the situation with a high probability.
Actual Patterns
- All
- Double Top
- Flag
- Head and Shoulders
- Pennant
- Rectangle
- Triangle
- Triple top
- All
- #AAPL
- #AMZN
- #Bitcoin
- #EBAY
- #FB
- #GOOG
- #INTC
- #KO
- #MA
- #MCD
- #MSFT
- #NTDOY
- #PEP
- #TSLA
- #TWTR
- AUDCAD
- AUDCHF
- AUDJPY
- AUDUSD
- EURCAD
- EURCHF
- EURGBP
- EURJPY
- EURNZD
- EURRUB
- EURUSD
- GBPAUD
- GBPCHF
- GBPJPY
- GBPUSD
- GOLD
- NZDCAD
- NZDCHF
- NZDJPY
- NZDUSD
- SILVER
- USDCAD
- USDCHF
- USDJPY
- USDRUB
- All
- M5
- M15
- M30
- H1
- D1
- All
- Buy
- Sale
- All
- 1
- 2
- 3
- 4
- 5
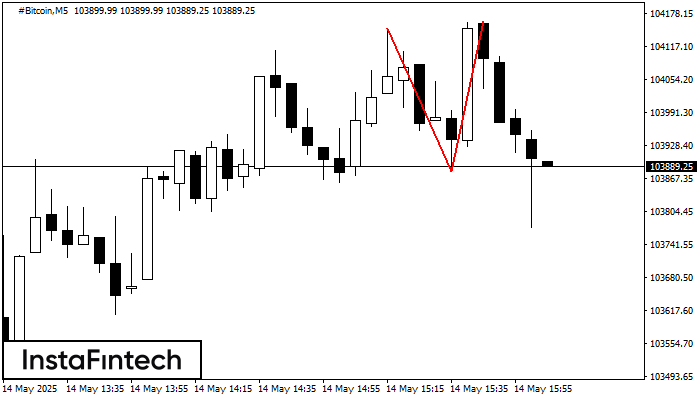
The Double Top reversal pattern has been formed on #Bitcoin M5. Characteristics: the upper boundary 104149.50; the lower boundary 103880.45; the width of the pattern is 28327 points. Sell trades
The M5 and M15 time frames may have more false entry points.
Open chart in a new window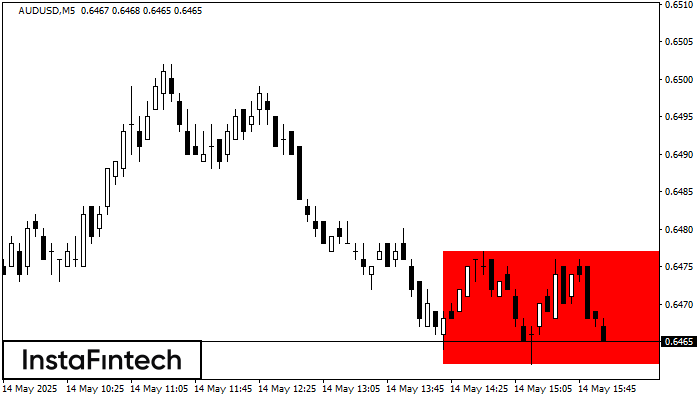
According to the chart of M5, AUDUSD formed the Bearish Rectangle. The pattern indicates a trend continuation. The upper border is 0.6477, the lower border is 0.6462. The signal means
The M5 and M15 time frames may have more false entry points.
Open chart in a new window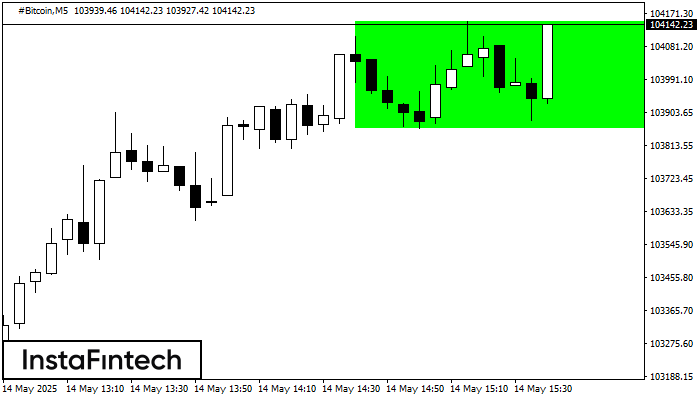
According to the chart of M5, #Bitcoin formed the Bullish Rectangle. This type of a pattern indicates a trend continuation. It consists of two levels: resistance 104149.50 and support 103860.12
The M5 and M15 time frames may have more false entry points.
Open chart in a new window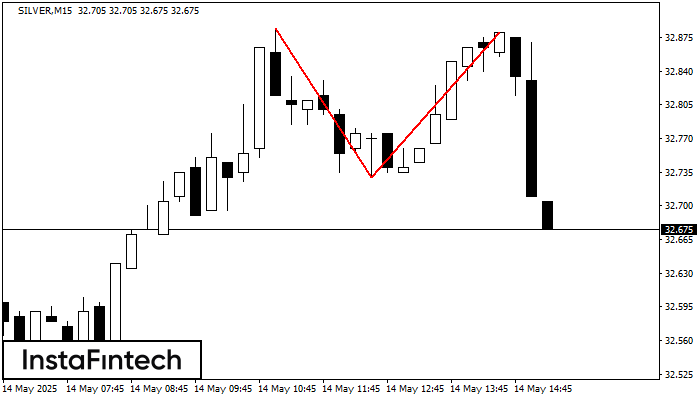
On the chart of SILVER M15 the Double Top reversal pattern has been formed. Characteristics: the upper boundary 32.88; the lower boundary 32.73; the width of the pattern 150 points
The M5 and M15 time frames may have more false entry points.
Open chart in a new window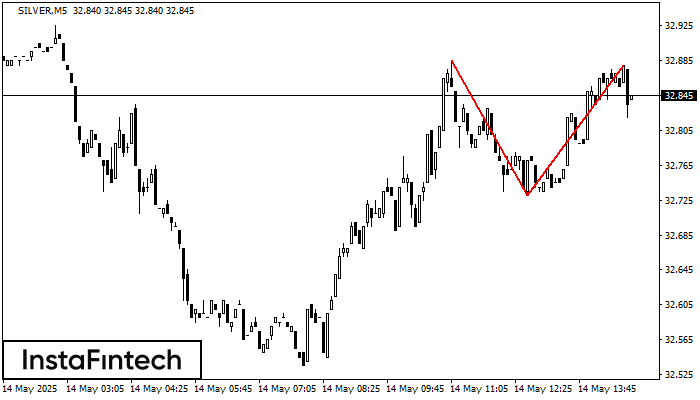
On the chart of SILVER M5 the Double Top reversal pattern has been formed. Characteristics: the upper boundary 32.88; the lower boundary 32.73; the width of the pattern 150 points
The M5 and M15 time frames may have more false entry points.
Open chart in a new window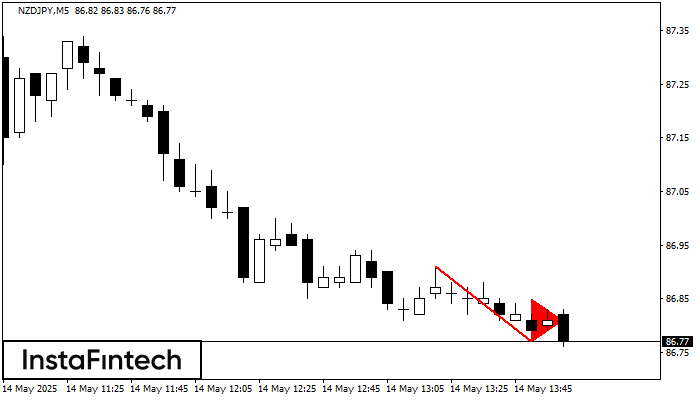
The Bearish pennant pattern has formed on the NZDJPY M5 chart. The pattern signals continuation of the downtrend in case the pennant’s low of 86.77 is broken through. Recommendations: Place
The M5 and M15 time frames may have more false entry points.
Open chart in a new window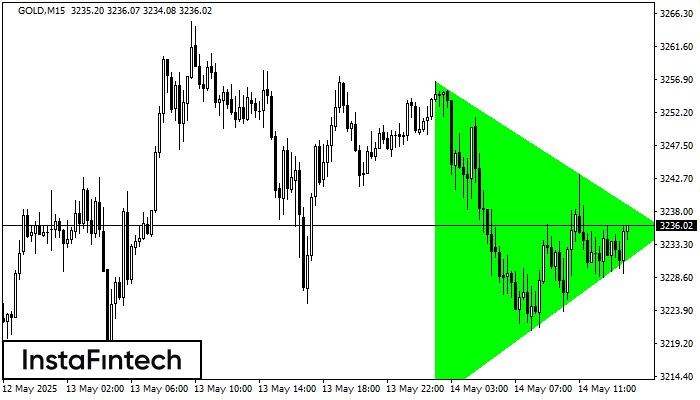
According to the chart of M15, GOLD formed the Bullish Symmetrical Triangle pattern, which signals the trend will continue. Description. The upper border of the pattern touches the coordinates 3256.66/3235.31
The M5 and M15 time frames may have more false entry points.
Open chart in a new window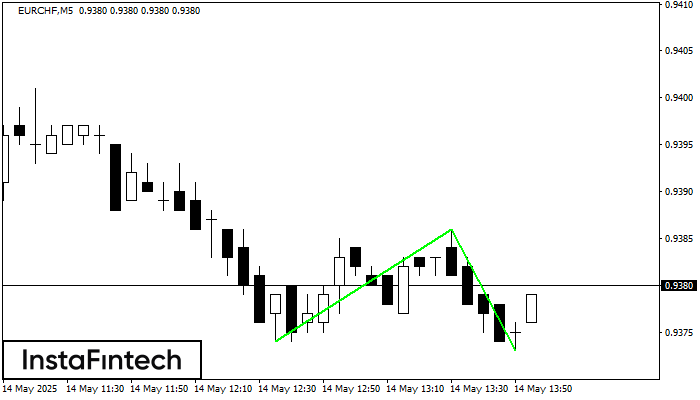
The Double Bottom pattern has been formed on EURCHF M5. This formation signals a reversal of the trend from downwards to upwards. The signal is that a buy trade should
The M5 and M15 time frames may have more false entry points.
Open chart in a new window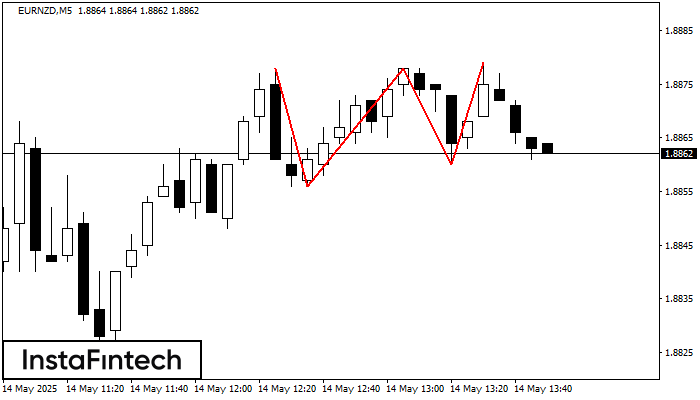
The Triple Top pattern has formed on the chart of the EURNZD M5 trading instrument. It is a reversal pattern featuring the following characteristics: resistance level -1, support level -4
The M5 and M15 time frames may have more false entry points.
Open chart in a new window