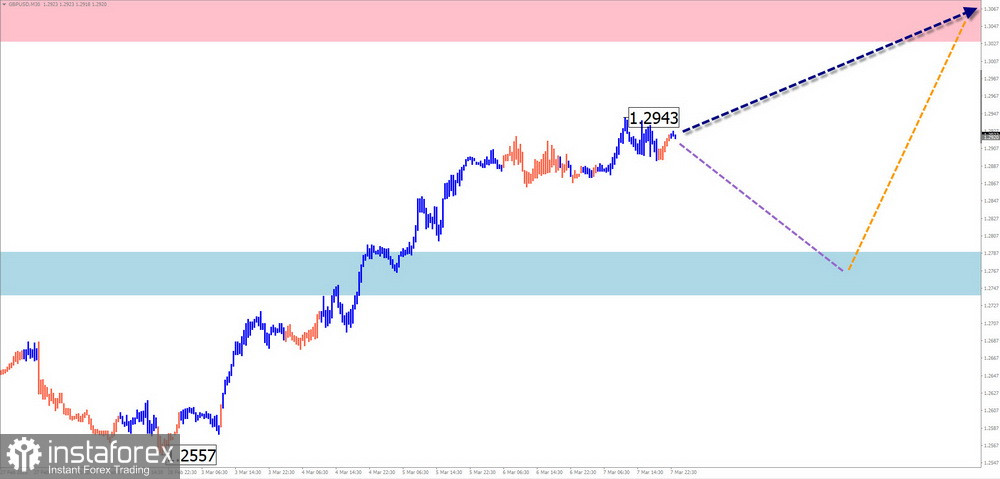
GBP/USD
Analysis:The upward wave that started on January 13th remains incomplete, forming a new segment of the dominant global uptrend. The pair is currently trading within a narrow range between opposing zones of support and resistance.
Forecast:A sideways movement is expected for the upcoming week. Early in the week, a bearish trajectory is more likely, followed by a potential reversal and renewed upward movement toward the resistance zone by the weekend.
Potential Reversal Zones:
- Resistance: 1.3030–1.3080
- Support: 1.2790–1.2740
Trading Recommendations:
- Selling: High risk and potentially unprofitable.
- Buying: Recommended after confirmed reversal signals appear in the support zone.
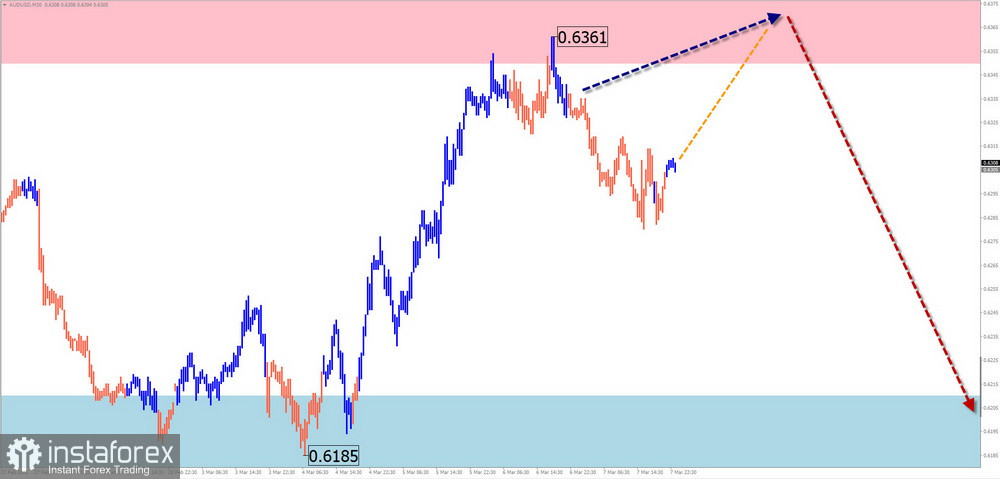
AUD/USD
Analysis:Since early February, a bullish wave has defined the short-term trend for the Australian dollar. However, the final segment (C) has been undergoing a counter-correction for the past two weeks, which remains unfinished. The calculated support level aligns with the upper boundary of a potential reversal zone on the daily timeframe.
Forecast:In the coming days, a price rebound is likely, though its upside potential is limited by resistance levels. A subsequent reversal and continuation of the downward movement toward support is expected.
Potential Reversal Zones:
- Resistance: 0.6350–0.6400
- Support: 0.6210–0.6160
Trading Recommendations:
- Buying: Can be considered for intraday trading with a small volume size until the first signs of a trend reversal appear.
- Selling: Favorable if confirmed reversal signals appear near the resistance area.
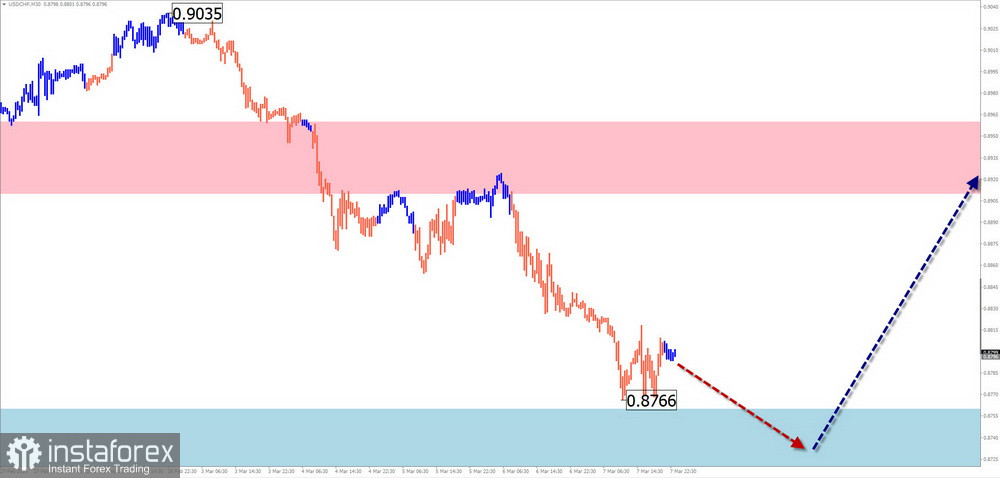
USD/CHF
Analysis:The Swiss franc has been in a downward correction for the past two months, within the broader primary trend of the currency pair. While the correction appears structurally complete, no strong reversal signals have been observed on the chart. The calculated support level is aligned with the upper boundary of a major reversal zone.
Forecast:In the next few days, price movement is expected to remain near the support zone, with an increased probability of a bullish reversal by the end of the week. A sharp rise in volatility and temporary break below support cannot be ruled out.
Potential Reversal Zones:
- Resistance: 0.8910–0.8960
- Support: 0.8760–0.8710
Trading Recommendations:
- Buying: Premature until confirmed reversal signals emerge at the support level.
- Selling: High risk and low potential, likely to result in losses.
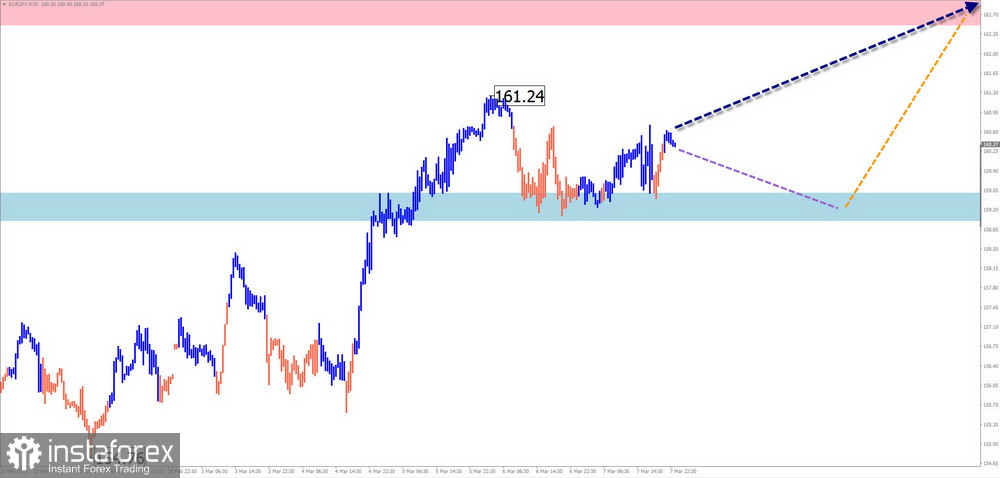
EUR/JPY
Analysis:The unfinished bearish wave in EUR/JPY began in late 2023. A bullish correction at the end of February brought prices closer to a strong reversal zone. Currently, price action remains sideways, forming an interim pullback.
Forecast:At the start of the week, the pair is expected to move along the support boundary, possibly testing the lower edge. Toward the weekend, a reversal and renewed price growth are likely. A break above resistance within the weekly period is unlikely.
Potential Reversal Zones:
- Resistance: 162.50–163.00
- Support: 159.50–159.00
Trading Recommendations:
- Selling: Low potential, likely to be unprofitable.
- Buying: Recommended only after confirmed reversal signals in the support zone.
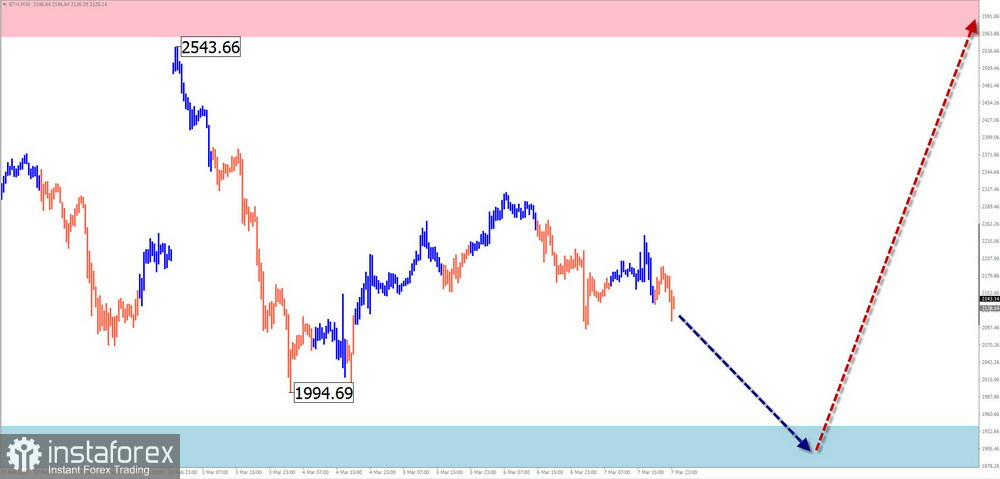
Ethereum (ETH/USD)
Analysis:The four-hour chart shows that Ethereum's unfinished wave has been forming a descending stretched flat since November 2023. The wave structure is nearing completion, with the price fluctuating within a narrow corridor between opposing zones.
Forecast:The overall sideways movement is expected to continue next week. Early in the week, a bearish trajectory is more likely, with pressure on the lower boundary of support. As the week progresses, a reversal and renewed price growth toward resistance are expected.
Potential Reversal Zones:
- Resistance: 2560–2660
- Support: 1940–1840
Trading Recommendations:
- Selling: Limited potential, carries high risk.
- Buying: Can be considered after confirmed reversal signals appear near the support zone.
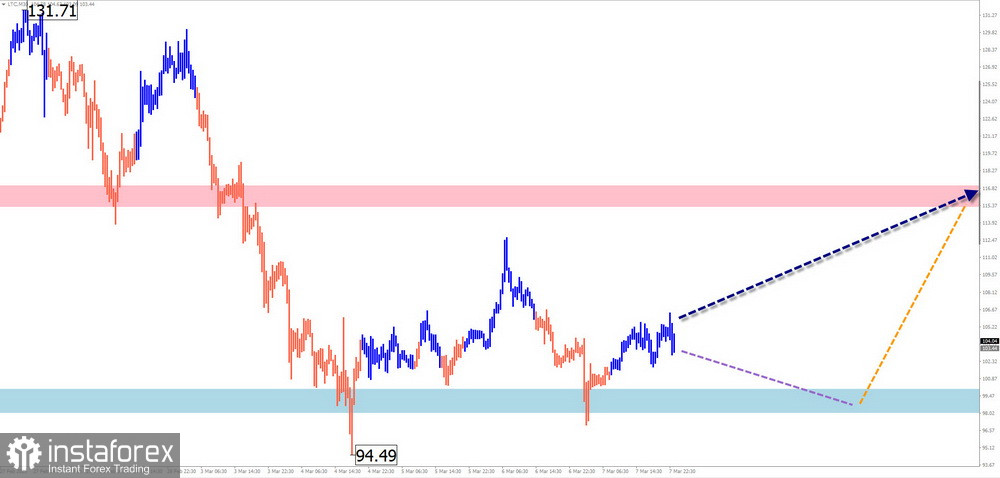
Litecoin (LTC/USD)
Analysis:Since early February, Litecoin has been following an upward trend, with a correctional pullback forming over the past three weeks. The price is currently near the lower boundary of a major resistance zone. No clear signals of an imminent trend reversal have been observed yet.
Forecast:A sideways trend is expected to continue throughout the week. After a potential test of support, a reversal may form, leading to a bullish move either by the end of the current week or in the following week.
Potential Reversal Zones:
- Resistance: 115.20–116.20
- Support: 100.00–99.00
Trading Recommendations:
- Selling: Low potential and high risk.
- Buying: Can be considered after confirmed signals from trading systems appear near the support zone.
Explanation of the Simplified Wave Analysis (SWA):
In SWA, all waves consist of three segments (A-B-C). The analysis focuses on the last incomplete wave on each timeframe. The dotted lines indicate expected movements.
Important Notice:
The wave algorithm does not account for the time duration of pri