signal strength 3 of 5
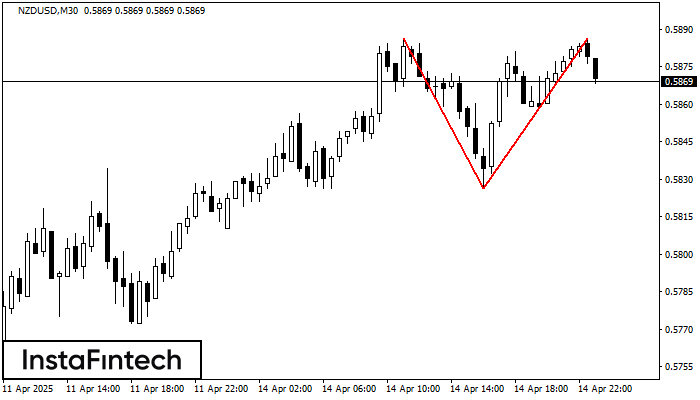
The Double Top reversal pattern has been formed on NZDUSD M30. Characteristics: the upper boundary 0.5886; the lower boundary 0.5826; the width of the pattern is 60 points. Sell trades are better to be opened below the lower boundary 0.5826 with a possible movements towards the 0.5796 level.
- All
- Double Top
- Flag
- Head and Shoulders
- Pennant
- Rectangle
- Triangle
- Triple top
- All
- #AAPL
- #AMZN
- #Bitcoin
- #EBAY
- #FB
- #GOOG
- #INTC
- #KO
- #MA
- #MCD
- #MSFT
- #NTDOY
- #PEP
- #TSLA
- #TWTR
- AUDCAD
- AUDCHF
- AUDJPY
- AUDUSD
- EURCAD
- EURCHF
- EURGBP
- EURJPY
- EURNZD
- EURRUB
- EURUSD
- GBPAUD
- GBPCHF
- GBPJPY
- GBPUSD
- GOLD
- NZDCAD
- NZDCHF
- NZDJPY
- NZDUSD
- SILVER
- USDCAD
- USDCHF
- USDJPY
- USDRUB
- All
- M5
- M15
- M30
- H1
- D1
- All
- Buy
- Sale
- All
- 1
- 2
- 3
- 4
- 5
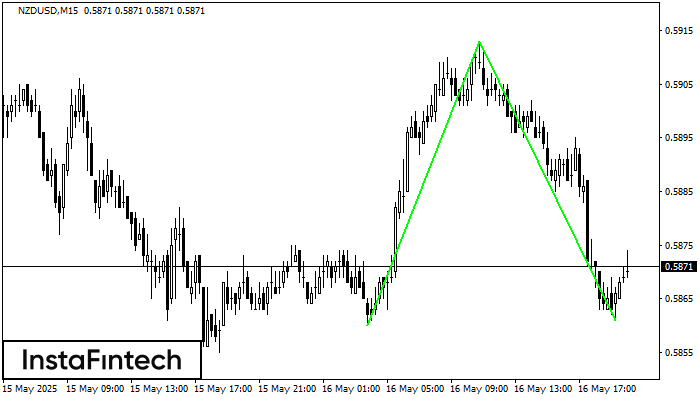
El patrón Doble Piso ha sido formado en NZDUSD M15. Características: el nivel de soporte 0.5860; el nivel de resistencia 0.5913; el ancho del patrón 53 puntos. Si el nivel
Los marcos de tiempo M5 y M15 pueden tener más puntos de entrada falsos.
Open chart in a new window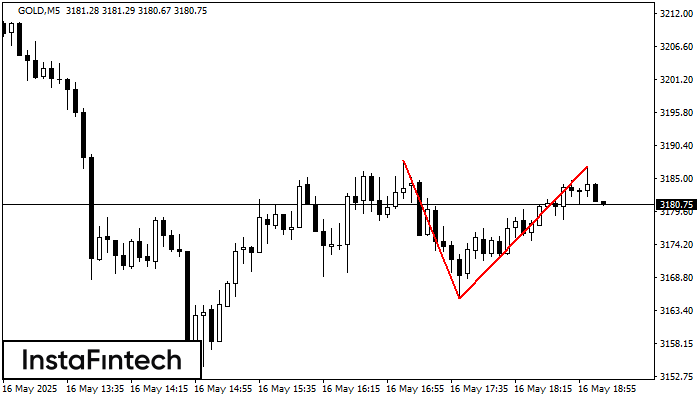
El patrón de reversión Doble Techo ha sido formado en GOLD M5. Características: el límite superior 3187.99; el límite inferior 3165.48; el ancho del patrón es 2143 puntos. Es mejor
Los marcos de tiempo M5 y M15 pueden tener más puntos de entrada falsos.
Open chart in a new window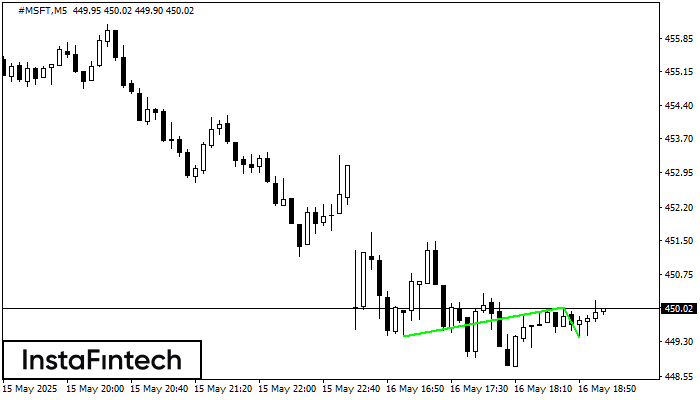
El patrón Doble Piso ha sido formado en #MSFT M5. Esta formación señala una reversión de la tendencia de bajista a alcista. La señal es que se debe abrir
Los marcos de tiempo M5 y M15 pueden tener más puntos de entrada falsos.
Open chart in a new window