signal strength 3 of 5

The Double Bottom pattern has been formed on NZDCAD M30. Characteristics: the support level 0.8188; the resistance level 0.8232; the width of the pattern 44 points. If the resistance level is broken, a change in the trend can be predicted with the first target point lying at the distance of 43 points.
Vea asimismo
- All
- Double Top
- Flag
- Head and Shoulders
- Pennant
- Rectangle
- Triangle
- Triple top
- All
- #AAPL
- #AMZN
- #Bitcoin
- #EBAY
- #FB
- #GOOG
- #INTC
- #KO
- #MA
- #MCD
- #MSFT
- #NTDOY
- #PEP
- #TSLA
- #TWTR
- AUDCAD
- AUDCHF
- AUDJPY
- AUDUSD
- EURCAD
- EURCHF
- EURGBP
- EURJPY
- EURNZD
- EURRUB
- EURUSD
- GBPAUD
- GBPCHF
- GBPJPY
- GBPUSD
- GOLD
- NZDCAD
- NZDCHF
- NZDJPY
- NZDUSD
- SILVER
- USDCAD
- USDCHF
- USDJPY
- USDRUB
- All
- M5
- M15
- M30
- H1
- D1
- All
- Buy
- Sale
- All
- 1
- 2
- 3
- 4
- 5
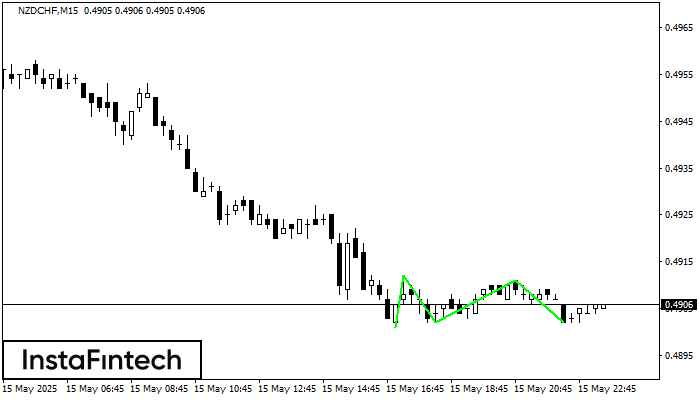
El patrón Triple Piso ha sido formado en NZDCHF M15. Este tiene las siguientes características: nivel de resistencia 0.4912/0.4911; nivel de soporte 0.4901/0.4902; el ancho es 11 puntos. En caso
Los marcos de tiempo M5 y M15 pueden tener más puntos de entrada falsos.
Open chart in a new window
Según el gráfico de M15, el #TSLA formó el patrón Triángulo Simétrico Alcista. El límite inferior del patrón toca las coordenadas 332.24/342.17 donde el límite superior cruza 349.71/342.17
Los marcos de tiempo M5 y M15 pueden tener más puntos de entrada falsos.
Open chart in a new window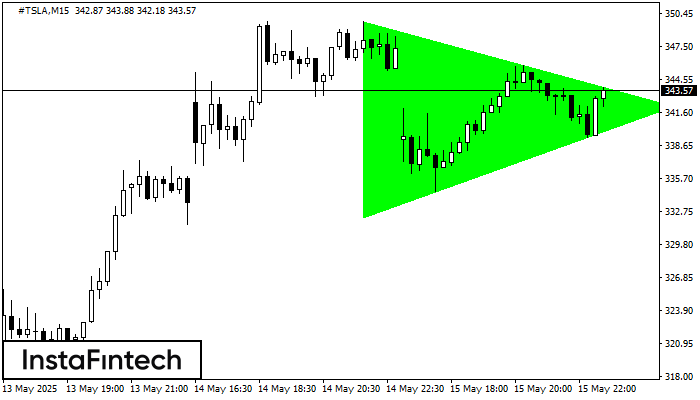
Según el gráfico de M15, el #TSLA formó el patrón Triángulo Simétrico Alcista. El límite inferior del patrón toca las coordenadas 332.24/342.17 donde el límite superior cruza 349.71/342.17
Los marcos de tiempo M5 y M15 pueden tener más puntos de entrada falsos.
Open chart in a new window