signal strength 2 of 5

The Double Bottom pattern has been formed on #EBAY M15; the upper boundary is 67.35; the lower boundary is 65.16. The width of the pattern is 215 points. In case of a break of the upper boundary 67.35, a change in the trend can be predicted where the width of the pattern will coincide with the distance to a possible take profit level.
The M5 and M15 time frames may have more false entry points.
- All
- Double Top
- Flag
- Head and Shoulders
- Pennant
- Rectangle
- Triangle
- Triple top
- All
- #AAPL
- #AMZN
- #Bitcoin
- #EBAY
- #FB
- #GOOG
- #INTC
- #KO
- #MA
- #MCD
- #MSFT
- #NTDOY
- #PEP
- #TSLA
- #TWTR
- AUDCAD
- AUDCHF
- AUDJPY
- AUDUSD
- EURCAD
- EURCHF
- EURGBP
- EURJPY
- EURNZD
- EURRUB
- EURUSD
- GBPAUD
- GBPCHF
- GBPJPY
- GBPUSD
- GOLD
- NZDCAD
- NZDCHF
- NZDJPY
- NZDUSD
- SILVER
- USDCAD
- USDCHF
- USDJPY
- USDRUB
- All
- M5
- M15
- M30
- H1
- D1
- All
- Buy
- Sale
- All
- 1
- 2
- 3
- 4
- 5
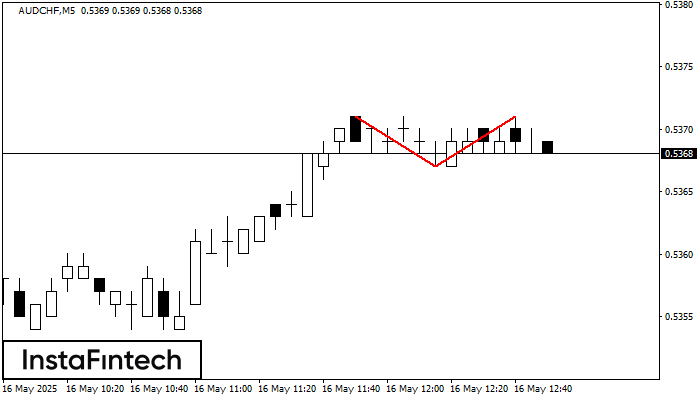
En el gráfico de AUDCHF M5 el patrón de reversión Doble Techo ha sido formado. Características: límite superior 0.5371; límite inferior 0.5367; el ancho del patrón 4 puntos. La señal
Los marcos de tiempo M5 y M15 pueden tener más puntos de entrada falsos.
Open chart in a new window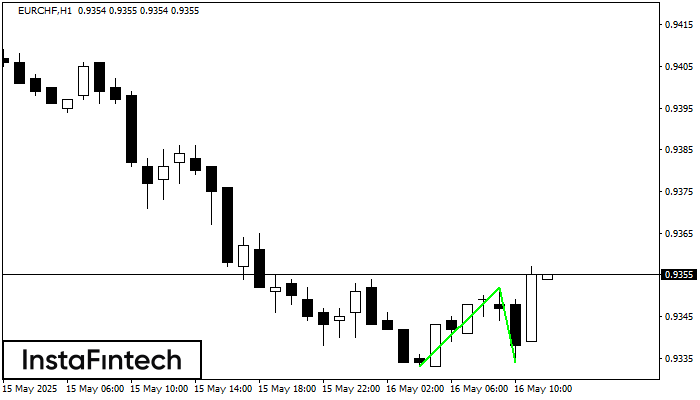
El patrón Doble Piso ha sido formado en EURCHF H1. Características: el nivel de soporte 0.9333; el nivel de resistencia 0.9352; el ancho del patrón 19 puntos. Si el nivel
Open chart in a new window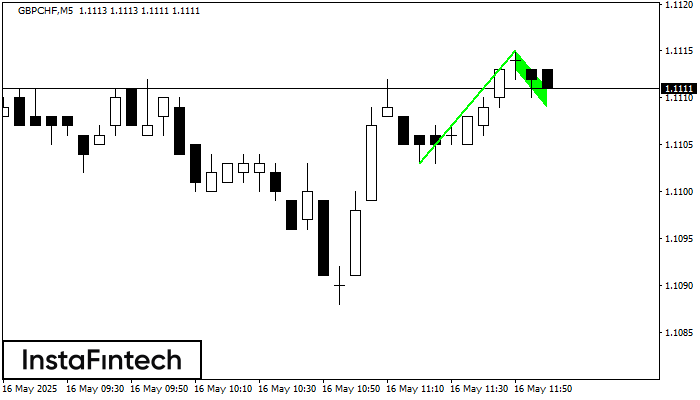
El patrón Bandera alcista que señala la continuación de una tendencia ha sido formado en el gráfico GBPCHF M5. Pronóstico: si el precio rompe por encima del alza del patrón
Los marcos de tiempo M5 y M15 pueden tener más puntos de entrada falsos.
Open chart in a new window