

signal strength 5 of 5
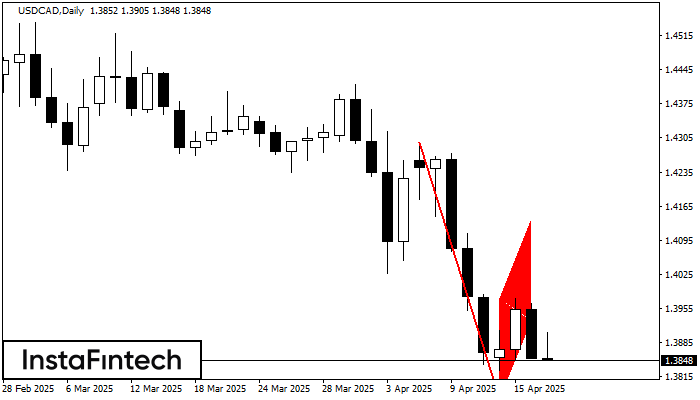
The Bearish Flag pattern has been formed on the chart USDCAD D1 which signals that the downward trend will continue. If the price breaks below the low at 1.3767, then it is most likely to move further downwards. The price will likely move by the number of points which equals the length of the flag pole (20 points).
- All
- Double Top
- Flag
- Head and Shoulders
- Pennant
- Rectangle
- Triangle
- Triple top
- All
- #AAPL
- #AMZN
- #Bitcoin
- #EBAY
- #FB
- #GOOG
- #INTC
- #KO
- #MA
- #MCD
- #MSFT
- #NTDOY
- #PEP
- #TSLA
- #TWTR
- AUDCAD
- AUDCHF
- AUDJPY
- AUDUSD
- EURCAD
- EURCHF
- EURGBP
- EURJPY
- EURNZD
- EURRUB
- EURUSD
- GBPAUD
- GBPCHF
- GBPJPY
- GBPUSD
- GOLD
- NZDCAD
- NZDCHF
- NZDJPY
- NZDUSD
- SILVER
- USDCAD
- USDCHF
- USDJPY
- USDRUB
- All
- M5
- M15
- M30
- H1
- D1
- All
- Buy
- Sale
- All
- 1
- 2
- 3
- 4
- 5
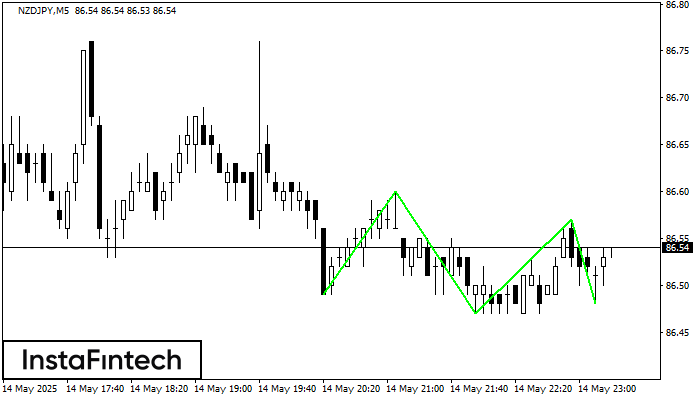
El patrón Triple Piso ha sido formado en NZDJPY M5. Este tiene las siguientes características: nivel de resistencia 86.60/86.57; nivel de soporte 86.49/86.48; el ancho es 11 puntos. En caso
Los marcos de tiempo M5 y M15 pueden tener más puntos de entrada falsos.
Open chart in a new window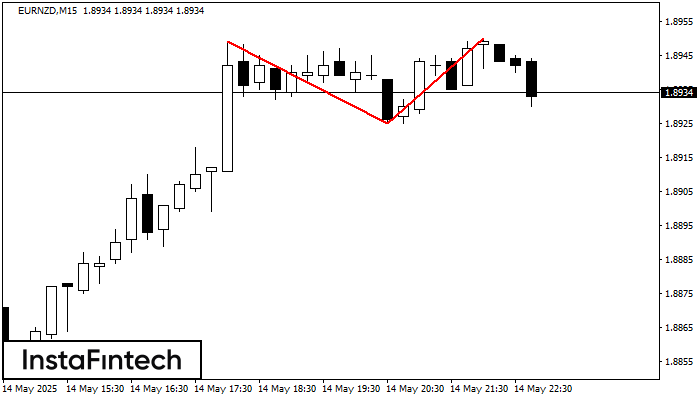
En el gráfico de EURNZD M15 el patrón de reversión Doble Techo ha sido formado. Características: límite superior 1.8950; límite inferior 1.8925; el ancho del patrón 25 puntos. La señal
Los marcos de tiempo M5 y M15 pueden tener más puntos de entrada falsos.
Open chart in a new window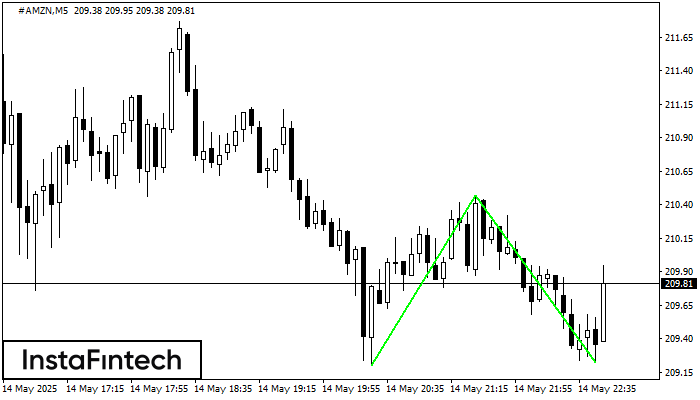
El patrón Doble Piso ha sido formado en #AMZN M5; el límite superior es 210.47; el límite inferior es 209.22. El ancho del patrón es 127 puntos. En caso
Los marcos de tiempo M5 y M15 pueden tener más puntos de entrada falsos.
Open chart in a new window


