empty
08.02.2023 08:17 PM
Technical analysis of EUR/USD for February 08, 2023

This image is no longer relevant

Overview:

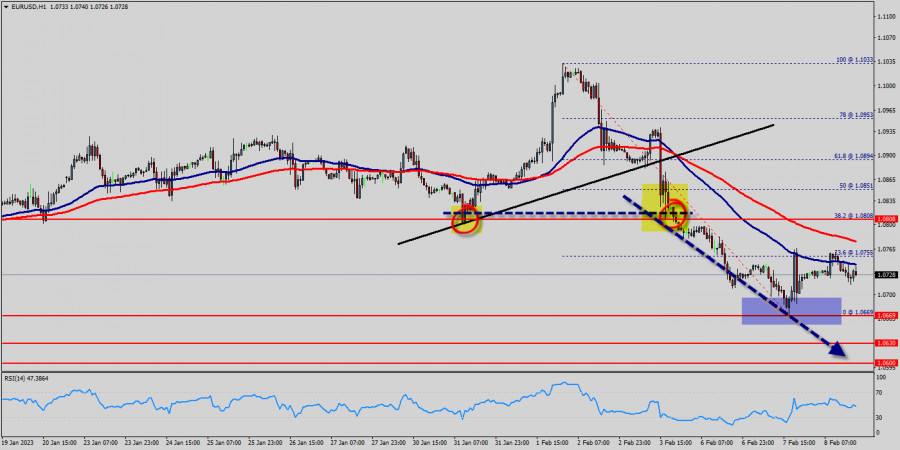
The EUR/USD pair has faced strong resistances at the levels of 1.0880 because support had become resistance last week. So, the strong resistance has been already formed at the level of 1.0880 and the pair is likely to try to approach it in order to test it again. However, if the pair fails to pass through the level of 1.0880, the market will indicate a bearish opportunity below the new strong resistance level of 1.0880 (the level of 1.0880 coincides with a ratio of 38.2% Fibonacci - last bullish wave - double top).

Moreover, the RSI starts signaling a downward trend, as the trend is still showing strength above the moving average (100) and (50). The trend of EUR/USD pair movement was controversial as it took place in the downtrend channel.

Due to the previous events, the price is still set between the levels of 1.0808 and 1.0669, so it is recommended to be careful while making deals in these levels because the prices of 1.0808 and 1.0669 are representing the resistance and support respectively.

Therefore, it is necessary to wait till the downtrend channel is passed through. Then the market will probably show the signs of a bearish market.

It should be noted that the volatility is very high for that the price of the EUR/USD pair is still trading between the prices of 1.0669 and 1.0808 in the coming hours.

Furthermore, the price has been set below the strong resistance at the levels of 1.0808 and 1.0851 which coincide with the 38.2% and 50% Fibonacci retracement levels respectively.

Thus, the market is indicating a bearish opportunity below 1.0808 so it will be good to sell at 1.0808 with the first target of 1.0669.

It will also call for a downtrend in order to continue towards 1.0630. The daily strong support is seen at 1.0600.

However, the stop loss should always be taken into account, for that it will be reasonable to set your stop loss at the level of 1.0851.

Moving averages, in the meantime, maintain their bearish slope way above the current level. Furthermore, although the news is bearish for the EUR/USD pair, professional may not want to sell weakness, but rather following a rebound rally.

Additionally, some aggressive counter-trend buyers may be defending parity. In case a continuousion takes place and the EUR/USD pair breaks through the support level of 1.0669 , a further decline to 1.0600 can occur which would indicate a bearish market.

Signal :

It should be noted that the 1.0808 price will act as a major resistance on Feb. 08th, 2023. Therefore, it will be too gainful to sell short below 1.0808 and look for further downside with 1.0669, 1.0630 and 1.0600 targets. It should also be reminded that stop loss must never exceed the maximum exposure amounts. Thus, stop loss should be placed at the 1.0851 level today.

เลือกช่วงเวลา
5
นาที
15
นาที
30
นาที
1
ชั่วโมง
4
ชั่วโมง
1
วัน
1
สัปดาห์
รับผลกำไรจากการเปลี่ยนแปลงอัตราสกุลเงินดิจิทัลกับ InstaForex.
ดาวน์โหลด MetaTrader 4 และเปิดการซื้อขายครั้งแรกของคุณ.
GBP/USD. วันที่ 6 พฤษภาคม จีนได้รับสิ่งที่สมควรแล้ว ในกราฟรายชั่วโมง คู่เงิน GBP/USD ยังคงเคลื่อนไหวในทิศทางด้านข้างในวันจันทร์ การเคลื่อนไหวในทิศทางด้านข้างนี้เริ่มขึ้นตั้งแต่สัปดาห์ที่แล้วเมื่อมีการเผยแพร่ชุดรายงานสำคัญในสหรัฐฯ และนักลงทุนคาดหวังว่าจะมีการซื้อขายที่เข้มข้นมากขึ้น อย่างไรก็ตาม รายงานส่วนใหญ่ถูกมองว่าไม่มีนัยสำคัญภายใต้สถานการณ์ปัจจุบัน และเทรดเดอร์ยังคงจับตาดูการแถลงข่าวของโดนัลด์ ทรัมป์อย่างใกล้ชิด โดยคาดหวังว่าจะมีการลดความตึงเครียดในความขัดแย้งระหว่างสหรัฐฯ และจีน ในช่วงที่ขาดข่าวสาร เทรดเดอร์มักไม่กระทำการใด
  • Grand Choice
    Contest by
    InstaForex
    InstaForex always strives to help you
    fulfill your biggest dreams.
    เข้าร่วมการแข่งขัน


บทความแนะนำ

EUR/USD. วันที่ 6 พฤษภาคม หมีทำทุกอย่างที่ทำได้แล้ว

ในวันจันทร์ คู่สกุลเงิน EUR/USD ได้เกิดการกลับตัวใหม่ในทิศทางที่เป็นผลดีแก่ดอลลาร์สหรัฐ แต่ครั้งนี้การขยับตัวลงยิ่งอ่อนแรงลง ในช่วงเวลาส่วนใหญ่ของสัปดาห์ที่ผ่านมา กลุ่มผู้ขายได้ทำการโจมตีที่ไม่ค่อยมีแรงสนับสนุน เนื่องจากถูกสวนกลับด้วยบรรยากาศข้อมูลเชิงลบจากสหรัฐอเมริกา รายงานส่วนใหญ่แสดงถึงสภาพเศรษฐกิจอเมริกาที่แย่ลง ทำให้ดอลลาร์สหรัฐแสดงการเติบโตได้ยากมาก ฉันไม่คาดว่าจะเห็นการลดลงต่ำกว่าระดับการแก้ไข 100.0% ที่ 1.1265 ในอนาคตอันใกล้นี้

Samir Klishi 10:30 2025-05-06 UTC+2

GBP/USD. วันที่ 6 พฤษภาคม จีนได้รับสิ่งที่สมควรแล้ว

ในกราฟรายชั่วโมง คู่เงิน GBP/USD ยังคงเคลื่อนไหวในทิศทางด้านข้างในวันจันทร์ การเคลื่อนไหวในทิศทางด้านข้างนี้เริ่มขึ้นตั้งแต่สัปดาห์ที่แล้วเมื่อมีการเผยแพร่ชุดรายงานสำคัญในสหรัฐฯ และนักลงทุนคาดหวังว่าจะมีการซื้อขายที่เข้มข้นมากขึ้น อย่างไรก็ตาม รายงานส่วนใหญ่ถูกมองว่าไม่มีนัยสำคัญภายใต้สถานการณ์ปัจจุบัน และเทรดเดอร์ยังคงจับตาดูการแถลงข่าวของโดนัลด์ ทรัมป์อย่างใกล้ชิด โดยคาดหวังว่าจะมีการลดความตึงเครียดในความขัดแย้งระหว่างสหรัฐฯ และจีน ในช่วงที่ขาดข่าวสาร เทรดเดอร์มักไม่กระทำการใด

Samir Klishi 10:25 2025-05-06 UTC+2

การวิเคราะห์ทางเทคนิคสำหรับการเคลื่อนไหวของราคาในวันเดียวของคู่เงิน GBP/AUD ข้ามสกุลเงิน, วันอังคารที่ 6 พฤษภาคม 2025

ในกราฟ 4 ชั่วโมง คู่สกุลเงิน GBP/AUD ยังคงถูกครอบงำโดยผู้ขาย ซึ่งยืนยันได้จากการเคลื่อนไหวของราคาที่เคลื่อนต่ำกว่าค่าเฉลี่ยเคลื่อนที่ (WMA) (30 Shift 2) แต่เนื่องจากอินดิเคเตอร์ Stochastic Oscillator ขณะนี้อยู่ในสถานะ

Arief Makmur 10:17 2025-05-06 UTC+2

การวิเคราะห์ทางเทคนิคของการเคลื่อนไหวราคาภายในการซื้อขายสินค้าโภคภัณฑ์น้ำมันดิบ วันอังคารที่ 6 พฤษภาคม 2025

จากการเคลื่อนไหวของราคาที่ก่อให้เกิดแนวโน้มสูงขึ้นและลดลงต่ำ ประกอบกับการลดลงของ WMA (30 Shift 2) และการเคลื่อนไหวของราคาน้ำมันดิบที่อยู่ต่ำกว่าแนวนี้ ชัดเจนว่าฝ่ายขายค่อนข้างมีอิทธิพล ซึ่งอาจทำให้ #CL ลงไปถึงระดับ 55.46 ได้ในอนาคตอันใกล้นี้ หากระดับนี้ถูกเจาะลงไปได้สำเร็จ #CL

Arief Makmur 10:16 2025-05-06 UTC+2

สัญญาณการซื้อขายสำหรับ EUR/USD ระหว่างวันที่ 5-8 พฤษภาคม 2025: ขายต่ำกว่า 1.1370 (200 EMA - 6/8 Murray)

ในช่วงต้นของการซื้อขายในอเมริกา คู่สกุลเงิน EUR/USD ซื้อขายอยู่ที่ประมาณ 1.1345 ถึงจุดสูงสุดของช่องทางขาลงและแสดงสัญญาณของการอ่อนแรง ยูโรอาจกลับเข้าสู่รอบขาลงหากมันเสถียรที่ต่ำกว่า 1.1370 ในอีกไม่กี่วันข้างหน้า อาจจะเข้าถึงระดับ 6/8 Murray ที่ 1.1230 และในที่สุดถึง

Dimitrios Zappas 17:34 2025-05-05 UTC+2

สัญญาณการซื้อขายสำหรับทองคำ (XAU/USD) ในวันที่ 5-8 พฤษภาคม 2025: ซื้อหากราคาสูงกว่า $3,305 (21 SMA - 7/8 Murray)

ในช่วงต้นของเซสชันสหรัฐ ราคาทองคำกำลังซื้อขายอยู่ที่ประมาณ 3,322 โดยมีการเคลื่อนไหวขาขึ้นอย่างแข็งแกร่ง แผนภูมิ H4 แสดงให้เห็นว่ามันกำลังทะลุแนวโน้มทิศทางขาลงอยู่ หาก XAU/USD ยังคงเพิ่มขึ้นในอีกไม่กี่ชั่วโมงข้างหน้า เราคาดว่ามันสามารถยืนเหนือ 3,303 ได้ จากนั้นอาจไปถึงระดับ 7/8

Dimitrios Zappas 17:31 2025-05-05 UTC+2

EUR/USD: ผลการประชุมของ Fed อาจทำให้คู่สกุลเงินนี้ร่วงลง

คู่สกุลกำลังเคลื่อนไหวในกรอบแคบๆ ใต้ระดับแนวต้านที่ 1.1345 รอคอยผลการประชุมนโยบายการเงินของ Fed ซึ่งจะสรุปในวันพุธที่ 7 พฤษภาคม หาก Fed ตัดสินใจคงอัตราดอกเบี้ยหลักไว้ตามที่คาดการณ์ไว้ในขณะนี้ และแสดงความสงสัยเกี่ยวกับความเป็นไปได้ในการลดอัตราดอกเบี้ยในเดือนมิถุนายน คู่สกุลนี้อาจถูกกดดันและลดลงได้ ในแง่ของเทคนิค คู่สกุลนี้กำลังเคลื่อนไหวในกรอบด้านข้างระหว่าง

Pati Gani 10:59 2025-05-05 UTC+2

EUR/USD – 5 พฤษภาคม: ตลาดแรงงานสหรัฐฯ ยังคงมีความหวัง

เมื่อวันศุกร์ คู่ EUR/USD ขยับขึ้นไปถึงระดับ 1.1374 แล้วดีดตัวออกมา กลับเป็นการเสริมค่าให้กับดอลลาร์สหรัฐอีกครั้ง ฝ่ายหมีจู่โจมอีกครั้ง แต่เพียงระยะเวลาสั้น ๆ และโดยรวมแล้วพวกเขายังคงค่อนข้างอ่อนแอ ดังนั้น ตามสถานการณ์ปัจจุบัน แนวโน้มขาขึ้นยังคงอยู่ การดีดตัวใหม่จากระดับ

Samir Klishi 10:57 2025-05-05 UTC+2

GBP/USD – 5 พฤษภาคม: ทรัมป์อาจยกเลิกการเก็บภาษีกับจีน

ในกราฟรายชั่วโมง คู่สกุลเงิน GBP/USD ได้ลดลงต่อในวันศุกร์มุ่งหน้าสู่ระดับการปรับฐาน Fibonacci 161.8% ที่ 1.3249 การดีดตัวจากระดับนี้จะเป็นประโยชน์ต่อปอนด์อังกฤษและอาจนำไปสู่การเติบโตบางส่วนไปสู่ระดับ 1.3357 การปิดต่ำกว่าระดับ 1.3249 จะเพิ่มโอกาสในการลดลงต่อไปยังระดับ 1.3149 แนวโน้มขาขึ้นยังคงอยู่ในปัจจุบัน

Samir Klishi 10:51 2025-05-05 UTC+2

คาดการณ์ตลาด Forex วันที่ 05/05/2025: EUR/USD, GBP/USD, USD/JPY, USD/CHF, USD/CAD และ Bitcoin

ลิงก์ที่เป็นประโยชน์: บทความอื่นๆ ของฉันสามารถอ่านได้ในส่วนนี้ คอร์ส InstaForex สำหรับผู้เริ่มต้น การวิเคราะห์ยอดนิยม เปิดบัญชีการซื้อขาย สำคัญ: ผู้เริ่มต้นในตลาดซื้อขาย Forex ต้องระมัดระวังในการตัดสินใจเข้าตลาดเป็นอย่างมาก ก่อนการประกาศรายงานสำคัญ ควรหลีกเลี่ยงการเข้าตลาด เพื่อหลีกเลี่ยงการถูกจับอยู่ในสภาวะตลาดที่มีการแกว่งตัวรุนแรงเนื่องจากความผันผวนที่เพิ่มขึ้น

Sebastian Seliga 10:23 2025-05-05 UTC+2
หากไม่สะดวกคุยในตอนนี้
ระบุคำถามไว้ได้ใน แชท.
Widget callback
 

Dear visitor,

Your IP address shows that you are currently located in the USA. If you are a resident of the United States, you are prohibited from using the services of InstaFintech Group including online trading, online transfers, deposit/withdrawal of funds, etc.

If you think you are seeing this message by mistake and your location is not the US, kindly proceed to the website. Otherwise, you must leave the website in order to comply with government restrictions.

Why does your IP address show your location as the USA?

  • - you are using a VPN provided by a hosting company based in the United States;
  • - your IP does not have proper WHOIS records;
  • - an error occurred in the WHOIS geolocation database.

Please confirm whether you are a US resident or not by clicking the relevant button below. If you choose the wrong option, being a US resident, you will not be able to open an account with InstaForex anyway.

We are sorry for any inconvenience caused by this message.