signal strength 1 of 5
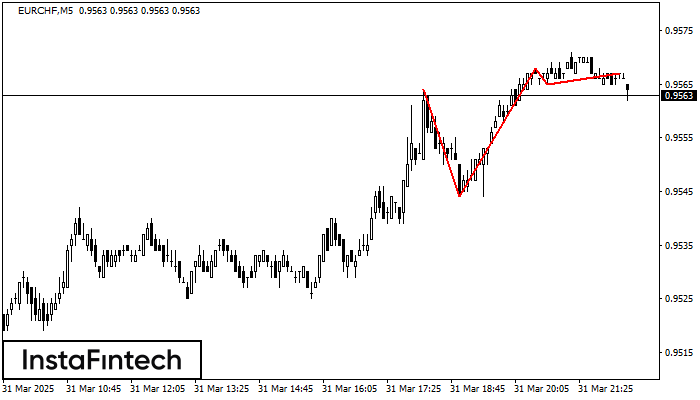
The Triple Top pattern has formed on the chart of the EURCHF M5 trading instrument. It is a reversal pattern featuring the following characteristics: resistance level -3, support level -21, and pattern’s width 20. Forecast If the price breaks through the support level 0.9544, it is likely to move further down to 0.9553.
The M5 and M15 time frames may have more false entry points.
ดูเพิ่มเติม
- All
- Double Top
- Flag
- Head and Shoulders
- Pennant
- Rectangle
- Triangle
- Triple top
- All
- #AAPL
- #AMZN
- #Bitcoin
- #EBAY
- #FB
- #GOOG
- #INTC
- #KO
- #MA
- #MCD
- #MSFT
- #NTDOY
- #PEP
- #TSLA
- #TWTR
- AUDCAD
- AUDCHF
- AUDJPY
- AUDUSD
- EURCAD
- EURCHF
- EURGBP
- EURJPY
- EURNZD
- EURRUB
- EURUSD
- GBPAUD
- GBPCHF
- GBPJPY
- GBPUSD
- GOLD
- NZDCAD
- NZDCHF
- NZDJPY
- NZDUSD
- SILVER
- USDCAD
- USDCHF
- USDJPY
- USDRUB
- All
- M5
- M15
- M30
- H1
- D1
- All
- Buy
- Sale
- All
- 1
- 2
- 3
- 4
- 5
was formed on 24.05 at 18:46:25 (UTC+0)
signal strength 2 of 5

อ้างอิงจากชาร์ตของ M15, #Bitcoin ที่ได้สร้างรูปแบบ รูปแบบสามเหลี่ยมสมมาตรขาขึ้น (Bullish Symmetrical Triangle) ออกมา ซึ่งแสดงให้เห็นว่า แนวโน้มยังคงเดินหน้าต่อไป คำอธิบาย ขอบเขตด้านบนของรูปแบบนี้สัมผัสพิกัด 109440.14/108872.57 แม้ว่าขอบเขตด้านล่างก้าวผ่าน
ขอบเตระยะเวลาใน M5 และ M15 อาจจะมีตำแหน่งการเข้าใช้งานที่ผิดพลาดมากยิ่งขึ้น
Open chart in a new windowwas formed on 23.05 at 23:00:20 (UTC+0)
signal strength 1 of 5

อ้างอิงจากชาร์ตของ M5, EURNZD ที่ได้สร้างรูปแบบ รูปแบบกราฟสี่เหลี่ยมผืนผ้าขาลง (Bearish Rectangle) ออกมา รูปแบบนี้แสดงถึง ความต่อเนื่องในแนวโน้ม ขอบเขตด้านบนคือ 1.8982 ส่วนขอบเขตด้านล่างคือ 1.8964 สัญญาณนี้แสดงถึง
ขอบเตระยะเวลาใน M5 และ M15 อาจจะมีตำแหน่งการเข้าใช้งานที่ผิดพลาดมากยิ่งขึ้น
Open chart in a new windowwas formed on 23.05 at 22:14:53 (UTC+0)
signal strength 1 of 5

อ้างอิงจากชาร์ตของ M5, AUDCHF ที่ได้สร้างรูปแบบ รูปแบบสามเหลี่ยมสมมาตรขาขึ้น (Bullish Symmetrical Triangle) ออกมา คำอธิบาย: นี้คือรูปแบบของความต่อเนื่องในแนวโน้ม 0.5335 และ 0.5329 เป็นพิกัดของขอบเขตด้านบนและด้านล่าง
ขอบเตระยะเวลาใน M5 และ M15 อาจจะมีตำแหน่งการเข้าใช้งานที่ผิดพลาดมากยิ่งขึ้น
Open chart in a new window